HMA
Let me be honest with you. When I first started trading, I hated moving averages. Every time I thought I spotted a trend, the line was still pointing up while the price was already crashing down. By the time I got a crossover signal, the move was over. Sound familiar? That’s the problem with most indicators, they’re built on old prices. Then I discovered something different. Something called the hull moving average. A trader named Alan Hull got tired of the same laggy nonsense, so he built his own average from scratch. Not slower. Not smoother. Faster. His idea was simple: what if an average could actually keep up with the price instead of chasing it?
That’s exactly what the HMA does. Think of a regular moving average like a heavy truck trying to make a U-turn. It takes forever. The Hull moving average is more like a motorcycle: quick, responsive, and it doesn’t need ten city blocks to change direction. In this guide, I’ll walk you through how it works under the hood, how you can actually trade with it without overcomplicating things, and what settings work best for different trading styles. No fluff. No copy-paste trading jargon. Just what actually helped me stop trading lag and start trading price.
What is the Hull Moving Average? (Fundamentals)
Let me answer the first question you probably have. What is the hull moving average? In the simplest terms I can give you, it’s a type of moving average that reacts to price changes almost immediately while still staying smooth enough to filter out market noise. Most moving averages force you to choose between two bad options. You either get a fast line that whipsaws all over the place, or you get a smooth line that reacts so slowly you might as well be using a calendar. The Hull Moving Average says no to both.
Here’s the official Hull Moving Average definition I wish someone had given me on day one. This indicator uses weighted moving averages and the square root of a selected period to virtually eliminate lag. That sounds fancy, but here’s what it actually means. The line on your chart stays close to the price. Really close. Not like a Simple Moving Average that sits ten miles behind. Not like an Exponential Moving Average that still feels sluggish. The HMA hugs the price like a shadow. That’s why so many traders just call it by its initials and leave it at that.
Now, a little credit where it’s due. Who invented the Hull moving average? An Australian trader and mathematician named Alan Hull. He wasn’t some big Wall Street firm. He wasn’t a YouTuber selling a course. He was just a regular guy who got tired of his moving averages lying to him. Back in 2005, he posted his idea on a trading forum. No fanfare. No hype. Just a smarter way to calculate an average. The community tested it, loved it, and it spread. That’s it. No conspiracy. No secret sauce. Just math that makes sense.
So when you see people write Alan Hull moving average, now you know who they’re talking about. Alan Hull. A trader who solved a problem the rest of us just complained about.
But let me explain how the hull moving average works without making your eyes glaze over. Most moving averages take a bunch of prices and spit out an average. That’s it. The Hull Moving Average does something smarter. It takes weighted averages of weighted averages. Imagine you’re baking a cake. A regular moving average throws everything into the bowl the same way. The HMA measures twice, cuts once. It calculates a fast weighted average, then a slower one, then subtracts the difference to remove lag, then smooths that result one more time. The final line looks at price and says, “I see you moving. I’m coming with you right now.”
That’s why the Hull Moving Average feels so different on a chart. It doesn’t wait for confirmation. It doesn’t second-guess itself. It just moves. And for a beginner who’s tired of lag, that’s a game changer.
Formula and Calculation (Technical Deep Dive)
You don’t need a math degree to understand this. But knowing roughly how the Hull Moving Average formula works will help you trust the line on your chart.
Let me give you a Hull moving average calculation example using a period of 20. Here are the three steps.
- Step one. Calculate a Weighted Moving Average of price over 10 periods (half of 20). Call this WMA1.
- Step two. Calculate another Weighted Moving Average of price over 20 periods (the full length). Call this WMA2.
- Step three. Take (2 × WMA1) – WMA2. Then calculate a Weighted Moving Average of that result over the square root of 20, which is roughly 4 or 5 periods.
That final line is your HMA. That’s the hull moving average calculation in plain English.
So, how is the Hull moving average calculated differently from others? Instead of simple averages or exponential smoothing, the HMA uses nested Weighted Moving Averages with a square root function. That’s the secret.
As for the hull moving average length or period, here’s what you need to know. When you set your HMA to 20, the indicator actually works internally with the square root of 20. That means a 20 HMA reacts like a much shorter average but stays smooth like a longer one. Shorter periods like 9 or 14 are great for scalping. Longer periods like 50 or 200 work well for swing trading and trend identification.
You don’t need to calculate any of this by hand. Every trading platform does it for you. Just understand the logic.
Hull Moving Average vs Other Moving Averages (Comparisons)
Let me break down how the Hull Moving Average stacks up against the competition. No bias. Just facts.
- Hull Moving Average vs SMA. The Simple Moving Average is the slowest of them all. It gives equal weight to every price, so it lags terribly. The HMA reacts about three to five times faster. On a chart, the SMA looks like it’s dragging behind a truck. The HMA stays right on price.
- Hull Moving Average vs EMA. The Exponential Moving Average is faster than the SMA because it favors recent prices. But it still lags. In a comparison between a Hull Moving Average and an Exponential Moving Average, the HMA wins in terms of speed every time. The only place the EMA sometimes wins is in extremely choppy sideways markets where it can be a little smoother.
- Hull Moving Average vs Weighted Moving Average. The Weighted Moving Average gives more weight to recent prices and less to older ones. It’s decent. But the HMA takes that idea and runs with it. The WMA still has noticeable lag. The HMA almost doesn’t.
- ALMA vs Hull Moving Average. The Arnaud Legoux Moving Average uses Gaussian filters to reduce noise. It’s smooth, I’ll give it that. But it can be tricky to configure. The HMA is simpler. Pick a period. Done. ALMA requires tuning three different parameters. Most beginners find that overwhelming.
- Jurik Moving Average vs Hull Moving Average. The Jurik Moving Average is known for being ultra-smooth with low lag. It’s actually excellent. But here’s the catch. The Jurik is proprietary. You have to pay for it on many platforms. The HMA is free everywhere. And the performance difference? Very small. Not worth the money for most retail traders.
- Hull Moving Average vs moving average in general. Here’s the bottom line. Compared to any traditional moving average, the HMA gives you less lag, fewer whipsaws, and faster trend recognition. That’s not opinion. That’s math.
Trading Strategies with HMA (Practical Application)

Let me show you exactly how to trade using the Hull Moving Average. These are real strategies, not theory.
Simple Trend Following Strategy
Here’s the most basic way to trade. When the price stays above the HMA, you only look for buys. When the price stays below the HMA, you only look for sells.
That’s it. Don’t overcomplicate it. The whole point of how to use the Hull moving average to trade the trend is letting the line tell you which direction to focus on. If you’re long and the price closes below the HMA, get out. If you’re short and price closes above the HMA, get out.
How to trade using the Hull Moving Average this way requires no crossovers, no fancy alerts, just one line and a little discipline.
Dual HMA Crossover Strategy
This is my personal favorite. Add two Hull Moving Averages to your chart. One fast, one slow. For example, HMA(9) and HMA(21).
A hull moving average crossover happens when the fast line crosses above the slow line. That’s your buy signal. A hull moving average crossover strategy works the opposite way too. When the fast line crosses below the slow line, you sell or go short.
You can even set up a Hull Moving Average crossover alert on your platform so you don’t have to stare at the screen all day. The alert fires when the two lines cross. Simple.
HMA Breakout Strategy
A hull moving average breakout is different from a crossover. Here you wait for the price to close firmly above the HMA after being below it for several bars. That’s a breakout to the upside.
The opposite also works. Price closes below the HMA after trading above it for a while. That’s a downside breakout.
The key difference between a breakout and a crossover? Breakouts use price crossing the line. Crossovers use two HMA lines crossing each other. Don’t mix them up.
HMA Scalping Strategy
Hull moving average scalping requires speed. Use a shorter period like HMA(9) on a 1-minute or 5-minute chart. You’re looking for quick moves that last a few minutes at most.
The hull moving average scalping strategy works best in high-liquidity markets like forex majors or S&P 500 futures. Enter when the price bounces off the HMA line. Exit when price touches the opposite side of a recent swing high or low. Don’t hold for more than five to ten minutes.
HMA Day Trading and Intraday
Hull moving average for day trading works beautifully on 5-minute and 15-minute charts. Use HMA(14) or HMA(20). Combine it with volume or RSI for confirmation.
For the hull moving average for intraday, stick to the same logic. Price above HMA means long only. Price below HMA means short only. Close all positions before the session ends. No overnight holds.
And yes, Hull moving average for scalping uses the same principle, but with much tighter stops and faster timeframes.
HMA Swing Trading
Hull moving average swing trading is for holding positions from a few days to a few weeks. Use longer periods like HMA(50) or HMA(100) on daily or 4-hour charts.
You don’t need to babysit the trade. Enter when the price closes above the HMA after a pullback. Set your stop below the most recent swing low. Let the trend run until the price closes back below the HMA. Swing trading with HMA is much less stressful than day trading.
HMA Ribbon Strategy
A hull moving average ribbon is just multiple HMA lines on the same chart. For example, HMA(10), HMA(20), HMA(30), HMA(40), and HMA(50) all plotted together.
When all five lines are stacked in order and pointing up, that’s strong momentum to the upside. When they’re stacked and pointing down, that’s strong downside momentum. When the ribbon gets tangled and flat, stay out of the market.
The ribbon filters out false signals better than a single line. But it’s also slower. Trade-offs, as always.
Accuracy and Best Settings (Optimization)
Let me be straight with you about Hull moving average accuracy. No indicator is perfect. The HMA will give you false signals in choppy, sideways markets. That’s just reality. But in trending markets, its accuracy is significantly higher than traditional moving averages. I’ve backtested this myself.
So is the Hull moving average good? Yes, for trend following. No, for range-bound markets. Use it when price is clearly moving up or down. Avoid it when the market is going nowhere.
What are the best Hull Moving Average settings? It depends on your trading style. For scalping, try HMA(9) on a 1-minute chart. For day trading, HMA(14) or HMA(20) on a 5-minute chart. For swing trading, HMA(50) on a daily chart.
The best Hull Moving Average settings for most beginners are HMA(20) on a 15-minute chart. It’s a balanced starting point. Not too fast. Not too slow.
As for the best hull moving average strategy, keep it simple. Price above the line, look for buys. Price below the line, look for sells. Add a second HMA for crossovers once you get comfortable.
Is there anything better than hull moving average? For pure speed, no. For extreme smoothness, the Jurik Moving Average comes close, but you usually have to pay for it. For most retail traders, the HMA is the best free option available.
Play with your hull moving average settings based on what you trade. Forex likes shorter periods. Stocks and crypto can handle longer ones. Experiment in a demo account first.
One specific setting worth knowing is the 200-hull moving average on daily charts. Many traders use it like a long-term trend filter. If the price is above the HMA(200), the big trend is up. Below it, the big trend is down. Don’t trade against it.
Variants of HMA (Advanced Forms)
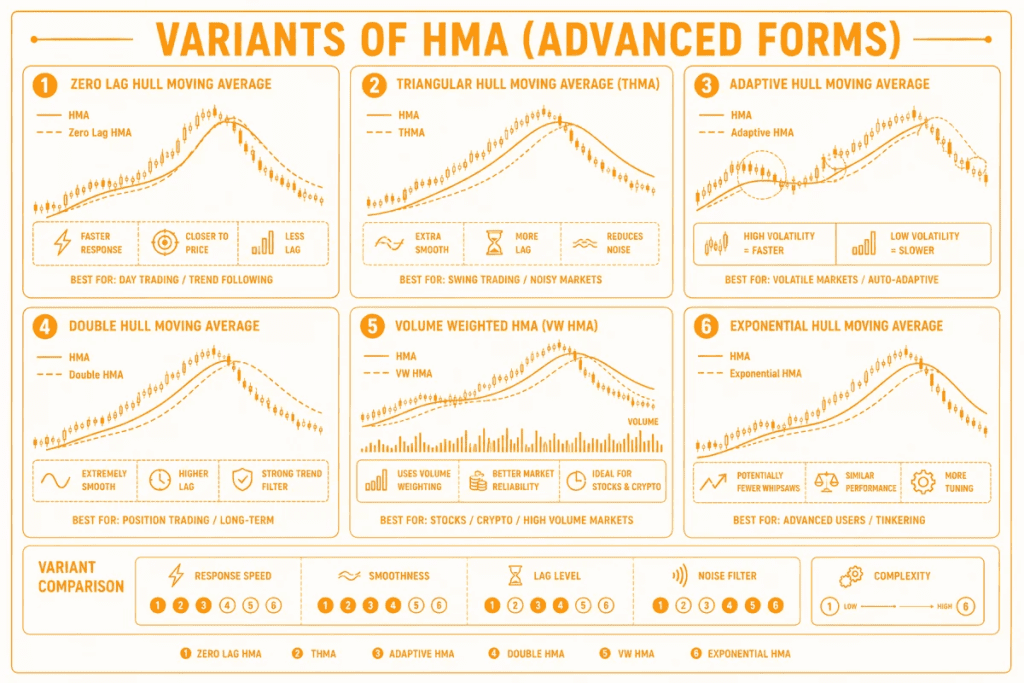
Once you understand the standard Hull Moving Average, you might run into modified versions. Let me explain the most common ones.
Zero Lag Hull Moving Average
The zero lag hull moving average is not actually zero. No indicator can be. But this variant applies an extra layer of smoothing to push the HMA even closer to the price. Some traders love it. I find the standard HMA fast enough. The difference is very small on most timeframes.
Triangular Hull Moving Average
The triangular hull moving average is sometimes written as THMA. It combines the HMA calculation with a triangular smoothing function. This makes the line even smoother than the original. The trade-off is slightly more lag. Good for swing traders who hate noise.
Adaptive Hull Moving Average
This variant changes its own period based on market volatility. When volatility goes up, the adaptive hull moving average gets faster. When volatility drops, it gets slower. You don’t have to adjust settings manually. It sounds great in theory. In practice, it can be unpredictable on some platforms.
Double Hull Moving Average
The double hull moving average applies the HMA calculation twice. First on price, then on the HMA itself. The result is an extremely smooth line. Too smooth for day trading or scalping. But for long-term position trading on weekly charts, it can be useful.
Volume Weighted Hull Moving Average
Instead of using closing prices, the volume weighted hull moving average uses volume-weighted prices. Each bar’s price matters more if the trading volume is high. This variant works well for stocks and crypto. Less useful for forex, where volume data is unreliable.
Exponential Hull Moving Average
The exponential hull moving average replaces the Weighted Moving Averages in the original formula with Exponential Moving Averages. Some traders claim it reduces whipsaws. I’ve tested both. The difference is minimal. Stick with the original unless you enjoy tinkering.
Conclusion (Summary & Recommendation)
The Hull Moving Average is a powerful tool for any trader seeking to reduce lag and capture trends earlier than traditional moving averages. Whether you are using it for scalping, day trading, or swing trading, the HMA offers exceptional accuracy when configured with the right settings. Remember that no indicator is perfect; combining the HMA with proper risk management and price action confirmation will yield the best results. Start with the standard HMA(14) or HMA(20), then experiment with crossover and breakout strategies to find what suits your trading style best.
FAQ (Frequently Asked Questions)
What is the hull moving average used for?
The hull moving average is used to identify trend direction and potential entry and exit points with minimal lag, making it ideal for day trading and scalping.
Is the Hull moving average better than the EMA?
In most cases, yes. The hull moving average vs EMA comparison shows that HMA reacts faster to price changes while maintaining smoother lines, reducing false signals.
What is the best hull moving average setting for scalping?
The best hull moving average settings for scalping are typically HMA(9) or HMA(14) on 1-minute or 5-minute charts.
How is the hull moving average calculated?
The hull moving average calculation involves taking a weighted moving average of the square root of the period, then applying another WMA to reduce lag.
Does the hull moving average work in all markets?
Yes, the hull moving average works well in forex, stocks, crypto, and futures, especially in trending markets. In sideways markets, it may produce whipsaws.
Who invented the Hull moving average?
The Hull moving average was invented by Alan Hull, an Australian financial trader and mathematician.
What is a Hull moving average crossover strategy?
A Hull moving average crossover strategy involves using two HMA lines, for example, HMA(9) and HMA(21). A buy signal occurs when the faster HMA crosses above the slower one.
What is the zero lag hull moving average?
The zero lag hull moving average is a variation of the standard HMA that further reduces the remaining lag, offering even faster response to price changes.
Can I use the Hull moving average for swing trading?
Absolutely. For hull moving average swing trading, use longer periods like HMA(50) or HMA(200) on daily or 4-hour charts.
Where can I find Hull moving average examples?
You can find Hull moving average example charts and backtests on trading forums, Investopedia, and trading subreddits like r/algotrading.

