How to Spot
a Trading Trend
Every successful trader knows that the trend is their friend. But before you can profit from market movements, you must first master how to identify a trend in trading. Without this skill, you’re essentially gambling – throwing darts in the dark and hoping for the best. I’ve been there, staring at a messy chart, watching prices jump up and down like a jackrabbit on coffee. It feels chaotic. But once you learn to see the market’s direction, the fog lifts. You stop guessing and start acting with confidence.
In this guide, I’ll walk you through exactly how to spot a trend in trading using nothing fancier than price charts, your own two eyes, and a couple of common-sense rules. No overhyped indicators. No secret sauce. Just a straightforward way to read what the market is actually doing. By the time we’re done, you’ll know how to look at any chart and immediately tell which way the wind is blowing. Sound good? Let’s roll.
Why You Must Learn How to Identify a Trend in Trading Before Entering Any Trade
Let me tell you something I learned the hard way. My first year trading, I lost a chunk of change because I kept trying to “catch the bottom.” A stock would drop for three days straight, and I’d jump in thinking, “This is it, time to buy the dip.” Then it would drop another three days. I was trading against the trend, and the market spanked me for it.
The Three Market Personalities
Before you can trade with confidence, you need to recognize which personality the market is showing today.
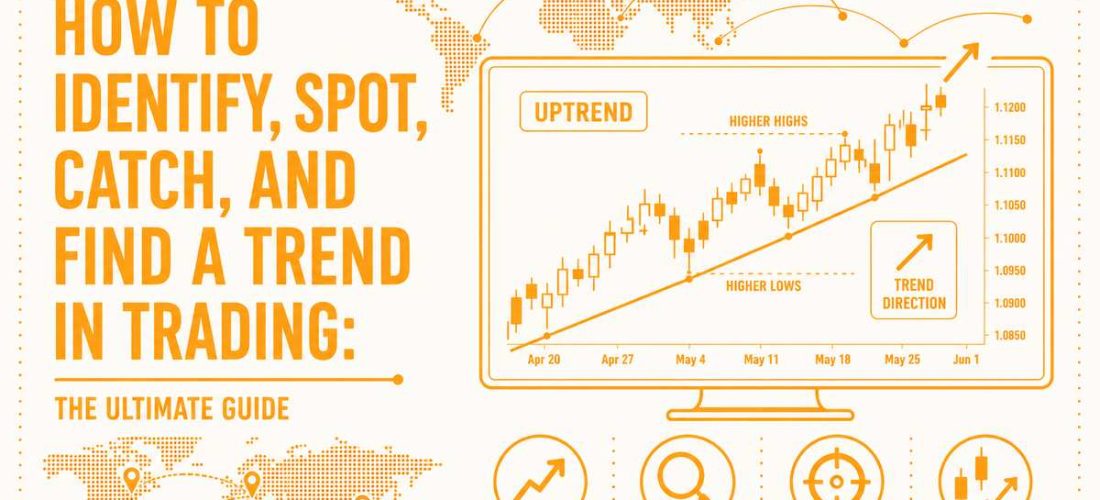
- Uptrend – Prices are climbing. You see higher highs and higher lows. Imagine stepping up a staircase.
- Downtrend – Prices are falling. You see lower highs and lower lows. Like walking down a flight of stairs.
- Sideways (Range) – Prices are going nowhere fast. Like a lazy river. This is where trend-followers get chopped to pieces.
To how to identify a trend in trading, just look at the swings. That’s it. No indicators required.
What Happens When You Fight the Trend
I’ve watched traders (myself included) do this over and over. They see a stock that’s dropped 10% and think, “It’s cheap now. Time to buy.” But the trend is still down. Here’s what typically happens:
- You enter a long position.
- The stock drops another 5%. You hold, hoping.
- It drops another 10%. You panic and sell at the bottom.
- A week later, it reverses and goes up. But you’re already out.
Fighting the trend is like swimming upstream in rapids. You might make progress for a minute, but eventually you’ll tire out and get swept away. Trading against the trend is one of the fastest ways to blow up your account.
Primary, Secondary, and Minor Trends – The Ocean Analogy
Not all trends are created equal. This is where how to identify trend in trading gets more useful. You have three layers of trend happening at the same time.
| Trend Type | Duration | Analogy |
|---|---|---|
| Primary trend | Months to years | The tide |
| Secondary trend | Weeks to months | The waves |
| Minor trend | Days to hours | The ripples |
As a trader, your job is to figure out which one you’re riding. Most beginners stare at the ripples (minor trends) and miss the tide entirely. That’s why they buy a “dip” that turns out to be the start of a major downtrend.
Once you get this down, everything changes. You stop fighting the market and start flowing with it. Trust me, that’s when trading actually becomes fun.
3 Reliable Methods to Spot a Trend in Trading Without Indicators
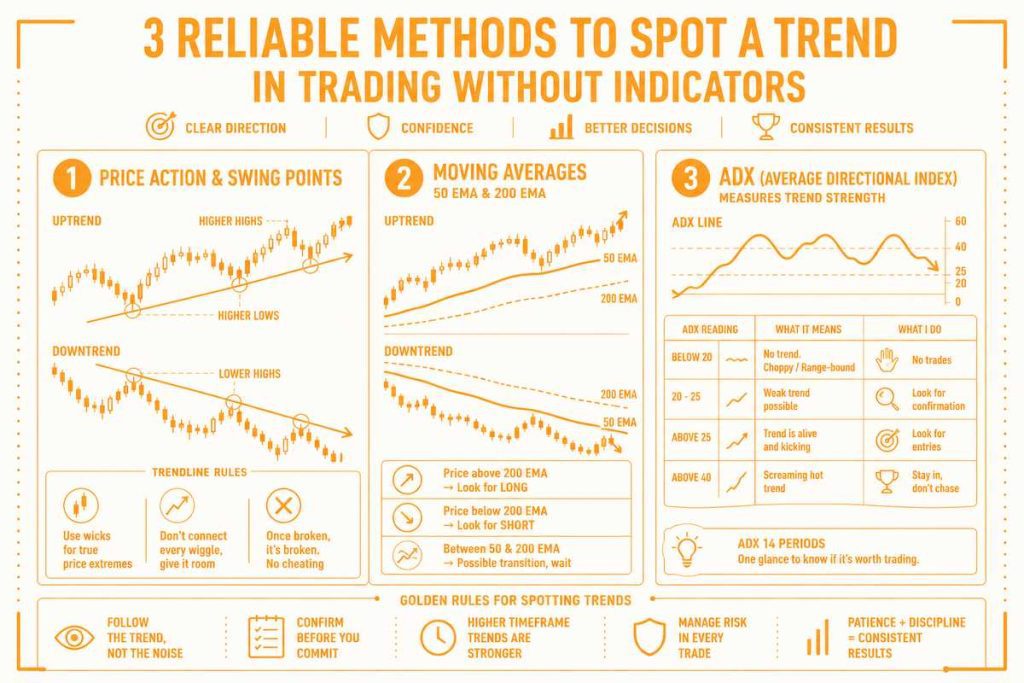
You don’t need a dozen flashing gadgets on your screen to read the market. In fact, most of the time, less is more. Here are three simple ways I use every single day to spot a trend in trading without getting lost in the noise.
1. Price Action & Swing Points
This is the oldest trick in the book, and it still works like a charm. Price action doesn’t lie. People do. But the chart? It’s just a record of what actually happened.
How to spot a trend in trading using swing points:
- Find two consecutive swing lows that are moving upward. Connect them with a straight line. That’s your uptrend line.
- Find two consecutive swing highs that are moving downward. Connect them. That’s your downtrend line.
- If price touches that line at least twice and bounces, the trend is valid.
Drawing trendlines correctly (the right way):
I see so many beginners forcing trendlines to fit their bias. Don’t do that. Here are my rules:
- Use the “candle wicks” or “bodies”? I prefer wicks. They show the true extreme of price rejection.
- Don’t try to connect every tiny wiggle. Give it some breathing room.
- Once a trendline breaks, it’s broken. Don’t draw a new one at a different angle to save your trade. That’s called cheating yourself.
When you master this, you can identify trend in trading on any chart, any market, any timeframe. No internet required except to pull up the chart itself.
2. Moving Averages (Simple but Effective)
Okay, I hear you. “You said ‘without indicators’!” And you’re right. But moving averages are just smoothed price data. They’re not magic. They’re a line that follows price like a loyal dog.
I use two specific ones: the 50 EMA and the 200 EMA. Here’s how they help me identify a trend in trading in about two seconds.
- Price above the 200 EMA? I’m only looking for long trades. That’s an uptrend.
- Price below the 200 EMA? I’m only looking for short trades. That’s a downtrend.
- Price sandwiched between the 50 and 200 EMA? That’s a possible transition. I wait.
The 200 EMA is my “north star.” It tells me which side of the boat I should be rowing on. If I’m long and price closes below the 200 EMA, I take a hard look in the mirror. Maybe I’m wrong. Maybe the trend has flipped.
3. ADX (Average Directional Index)
This one is a bit of a cheat code. The ADX doesn’t tell you up or down. It tells you how hard price is moving. Think of it like a speedometer for trends.
How I read the ADX:
| ADX Reading | What It Means | What I Do |
|---|---|---|
| Below 20 | No trend. The market is choppy or range-bound. | I sit on my hands. No trades. |
| 20 to 25 | Gray zone. Weak trend possible. | I look for confirmation from price action. |
| Above 25 | A trend is alive and kicking. | I pay attention and start looking for entries. |
| Above 40 | Screaming hot trend. But be careful. | I stay in if I’m already in, but I don’t chase. |
The ADX keeps me out of chop. And staying out of bad trades is half the battle when you’re learning how to spot a trend in trading. I set my ADX to 14 periods (the standard) and keep it at the bottom of my chart. One glance tells me whether to bother looking for a trend at all.
How to Catch a Trend in Trading Early for Maximum Profit
I used to be terrible at this. I’d see a stock ripping higher, wait for “confirmation,” and then buy right near the top. Then the pullback would hit, and I’d be sitting in red for two weeks. Sound familiar? Learning how to catch a trend in trading early changed everything for me.
The Problem With Entering Too Late
Buying at the top is not a strategy. It’s a donation to the market. Here’s what happens when you’re late to the party:
- You chase price. You buy because you’re afraid of missing out (FOMO).
- The trend pauses or pulls back. Suddenly you’re down 3-5%.
- You panic and sell. Then the trend continues without you.
I’ve been there more times than I’d like to admit. The fix? Stop chasing and start waiting for the right spot.
How to Catch a Trend in Trading Using Breakout Pullbacks
Here is my go-to method for getting in early without buying the exact top.
- Step 1: Identify a clear breakout above resistance or below support.
- Step 2: Wait. Do not enter immediately. Let the price come back to retest the breakout level.
- Step 3: Enter when the pullback shows signs of ending (a bullish candle, a hammer, or a bounce off a key moving average).
This is called a “pullback entry.” It’s how professionals catch a trend in trading without getting whipsawed. The breakout gets your attention. The pullback gives you your entry.
Volume Confirmation: The Silent Partner
Volume is the fuel behind any move. Without volume, a breakout is just a lie waiting to happen.
- Rising volume on the breakout = strong conviction. The trend has legs.
- Falling volume on the pullback = sellers are exhausted. The trend is likely to resume.
- Low volume on the breakout = fakeout. Stay away.
I never trust a trend unless volume backs it up. It’s like trying to drive a car with an empty gas tank. You might roll a few feet, but you’re not going anywhere.
Using Fibonacci Retracements to Enter on Dips
Fibonacci levels sound fancy, but they’re just common retracement zones. When a trend pulls back, it often finds support at the 38.2%, 50%, or 61.8% level.
Here’s how I use them to identify a trend in trading and get a good entry:
| Fibonacci Level | What I Do |
|---|---|
| 38.2% | Aggressive entry. Trend is very strong. |
| 50% | My sweet spot. Balanced risk and reward. |
| 61.8% | Last chance. If price breaks below this, the trend may be dead. |
I draw the Fibonacci from the most recent swing low to swing high (in an uptrend). Then I wait for price to drift back to the 50% area. If I see a bullish reversal candle there, I pull the trigger.
Real Example: Catching an Uptrend After a Higher Low Forms
Let me walk you through a real trade I took last year.
I was watching a stock that had been in a downtrend for weeks. Then I noticed something change. It made a low at 50, bounced to 55, then pulled back to 52. That 52 was a higher low, above the previous low of $50.
Here was my checklist:
- Higher low confirmed? Yes.
- 200 EMA sloping up? Yes.
- ADX above 25? Yes.
- Volume on the bounce higher than on the pullback? Yes.
How to Find Trend in Intraday Trading (5-Minute & 15-Minute Charts)
Intraday trading is a different beast. I learned that the hard way when I tried to use my daily chart strategies on a 1-minute chart. It was like showing up to a Formula One race with a minivan. The rules change when every tick matters. But once you figure out how to find trend in intraday trading, the short timeframes become your playground.
The Unique Challenges of Intraday
Before we get into solutions, let’s be real about what you’re up against.
- Noise – Price jumps around randomly on low timeframes. One second it’s up, the next it’s down. Your eyes can fool you.
- False breakouts – A stock breaks above resistance, you jump in, and five minutes later it crashes back down. That’s a fakeout. They happen constantly intraday.
- Low timeframes – The smaller the chart, the more chaos. A 5-minute chart has way more false signals than a daily chart.
I’m not saying this to scare you. I’m saying it so you don’t beat yourself up when things get messy. Everyone struggles with this at first. The key is having a system that filters out the garbage.
The 200-Period EMA on a 5-Minute Chart
This is my anchor. On a daily chart, the 200 EMA shows the long-term trend. On a 5-minute chart, it does the same thing – just for the intraday session.
Here’s how I use it to find trend in intraday trading:
- Price above the 200 EMA on the 5-minute chart? I only look for long trades during that session.
- Price below the 200 EMA? I only look for short trades.
- Price crossing back and forth across the 200 EMA? I step away. The trend isn’t clear.
I also watch the slope of the 200 EMA. If it’s flat, there’s no trend. If it’s pointing up or down like a ski slope, I pay attention. This one line keeps me out of more bad trades than anything else.
Combining RSI With Trendlines
The RSI (Relative Strength Index) is a momentum oscillator. On its own, it’s okay. But when you combine it with trendlines, it becomes a powerful filter.
My intraday RSI setup:
- Period: 14 (standard)
- Overbought: 70
- Oversold: 30
How I use it:
- In an uptrend (price above 200 EMA), I wait for RSI to dip below 50 but stay above 30. That’s a momentum pullback. Then I look for a bounce.
- If RSI goes below 30 in an uptrend, that’s a red flag. The trend might be failing.
- I never go long when RSI is above 70. Too late. I never go short when RSI is below 30. Too late.
The trendline tells me the direction. The RSI tells me the energy. Together, they help me spot a trend in trading before it runs out of steam.
Avoiding Chop – Only Trade When ADX > 25 on Intraday Charts
I mentioned the ADX earlier. On intraday charts, it’s even more critical. Chop is the enemy of intraday traders. The ADX is your bouncer at the door.
My intraday ADX rules:
| ADX Reading | What I Do |
|---|---|
| Below 20 | I don’t trade. Period. The market is ranging. |
| 20 to 25 | I watch but don’t act. I need confirmation. |
| Above 25 | I start looking for setups using the 200 EMA and RSI. |
| Above 40 | I’m cautious. The trend is hot but might reverse. I tighten my stop. |
I keep the ADX (14 period) at the bottom corner of my intraday chart. One glance tells me whether to even bother. If ADX is below 20, I walk away and come back later. Forcing a trade in chop is like trying to ice skate uphill.
Best Session Times to Spot a Trend in Trading Intraday
Not all hours are created equal. I’ve sat through the lunch hour watching price sit flat for 90 minutes. That’s not trading. That’s watching paint dry.
Here are the best times to spot a trend in trading intraday (Eastern Time):
| Session | Time (ET) | What to Expect |
|---|---|---|
| London Open | 3:00 AM – 5:00 AM | Quiet but trending. Good for forex. |
| New York Open | 9:30 AM – 12:00 PM | Most volume. Best trends. This is my sweet spot. |
| Overlap (London & NY) | 8:00 AM – 12:00 PM | High volatility. Strong trends. |
| Power Hour | 3:00 PM – 4:00 PM | Last hour of NY session. Trends often accelerate. |
I avoid 12:00 PM to 2:00 PM ET. That’s the lunch lull. Trends die. False breakouts multiply. I also avoid the first five minutes after the open. Too much chaos. I wait for the dust to settle.
Once you know how to find trend in intraday trading, you’ll stop fighting the clock and start trading when the odds are in your favor.
Common Mistakes When Trying to Identify a Trend in Trading
I’ve made every mistake on this list. Some of them more than once. Learning to identify trend in trading is one thing. Avoiding these traps is another. Let me save you the pain I went through.
Mistake #1 – Forcing a Trend in a Range-Bound Market
Not every market is trending. In fact, markets are range-bound about 70% of the time. But beginners look at a flat chart and still try to find a trend. It’s like trying to squeeze water from a rock.
Here’s what forcing a trend looks like:
- Drawing a diagonal trendline through random price wiggles that don’t actually line up.
- Buying because “it bounced off support” even though there’s no higher high.
- Using a moving average crossover in a chop zone and getting whipsawed five times in a row.
I learned to sit on my hands when the market is ranging. No trend? No trade. Simple as that. If you want to catch a trend in trading, you first have to accept that sometimes there’s nothing to catch.
Mistake #2 – Using the Wrong Timeframe to Identify a Trend in Trading
This one burned me badly. I’d look at a 1-minute chart, see an uptrend, go long, and then watch price crash. What happened? The 15-minute chart was in a downtrend. I was swimming against the tide without even knowing it.
The rule I live by now:
- Higher timeframe (daily or 4-hour) tells me the primary trend.
- Lower timeframe (1-hour or 15-minute) tells me where to enter.
- I never trade a lower timeframe trend that goes against the higher timeframe.
For example, if the daily chart is in a downtrend, I don’t go long on a 5-minute bounce. That bounce is just a dead cat bounce. It will fail. To properly identify trend in trading, you need to zoom out first, then zoom in.
Mistake #3 – Entering Without a Stop Loss Even After You Catch a Trend in Trading
I used to think stop losses were for wimps. “I’ll just watch the trade,” I told myself. Then I’d get a phone call or step away for lunch, and when I came back, my account was down 20%. I learned the hard way that pride doesn’t pay the bills.
Here’s the truth:
- You can perfectly catch a trend in trading and still lose money if you don’t use a stop loss.
- Trends reverse without warning. News drops. Banks move price. Your opinion doesn’t matter.
- A stop loss is not a prediction. It’s insurance.
My stop loss placement is simple. In an uptrend, I put it below the most recent swing low. In a downtrend, above the most recent swing high. Then I let it do its job. If I get stopped out, I get stopped out. There’s always another trade.
Mistake #4 – Ignoring Volume Divergence
Volume tells you if a trend is real or fake. I ignored volume for my first two years of trading. I regretted every single time.
Volume divergence explained simply:
- Price makes a higher high, but volume makes a lower high. That’s bearish divergence. The trend is tired.
- Price makes a lower low, but volume makes a higher low. That’s bullish divergence. Sellers are exhausted.
I remember one trade where I bought a breakout with beautiful price action. But volume was lower than the previous breakout. I ignored it. The breakout failed within an hour. Now I never enter a trade without checking volume first.
If you want to identify trend in trading correctly, volume is not optional. It’s the difference between a sustainable trend and a head fake.
Step-by-Step Workflow to Identify, Spot, Catch, and Find a Trend in Trading
I’m a checklist person. If I don’t have a process, I get sloppy. Over the years, I’ve boiled down everything I know into six simple steps. Follow these, and you’ll know exactly what to do every single time you sit down to trade.
Step 1: Choose Your Timeframe
This is where you decide what kind of trader you want to be today.
- Swing trading (daily chart) – I hold trades for days or weeks. Slower pace, less stress. I use this for stocks and crypto.
- Intraday (5-minute or 15-minute chart) – I’m in and out within hours. Faster pace, more screen time. I use this for futures and forex.
Pick one and stick to it for the whole session. Don’t bounce between timeframes. That’s a fast track to confusion. If you’re trying to find trend in intraday trading, your home base is the 5-minute or 15-minute chart.
Step 2: Draw Trendlines or Apply the 50/200 EMA
Now I get visual. I need to see the trend with my own eyes.
Option A (Trendlines):
- Connect at least two higher lows for an uptrend.
- Connect at least two lower highs for a downtrend.
- Price should respect the line. If it’s broken, the trend may be over.
Option B (50 and 200 EMA):
- Price above 200 EMA + 50 EMA above 200 EMA = uptrend.
- Price below 200 EMA + 50 EMA below 200 EMA = downtrend.
- Price chopping around both EMAs = no trend. Move on.
Either method works. I use both. The goal is to identify a trend in trading before I even think about entering.
Step 3: Check ADX > 25
I glance at my ADX indicator (14 period). This keeps me out of chop.
- ADX above 25? Green light. The trend has horsepower.
- ADX between 20 and 25? Yellow light. I wait for confirmation.
- ADX below 20? Red light. I close the chart and come back later.
This step takes two seconds. But it saves me hours of frustration. Especially when I’m trying to find trend in intraday trading where fakeouts are everywhere.
Step 4: Wait for a Pullback to Enter
This is the hardest step for beginners. You see a beautiful uptrend and you want to jump in right now. Don’t. You chase, you lose.
What I do instead:
- I mark the recent breakout level or a Fibonacci retracement zone (38.2% to 61.8%).
- I wait for price to come back to that zone.
- I look for a reversal candle (hammer, bullish engulfing, etc.).
- Then I enter.
This is how you catch a trend in trading early without buying the top. Patience pays here.
Step 5: Set Your Stop Loss Below the Last Swing Low (for an Uptrend)
I never enter a trade without knowing exactly where I’m wrong.
For an uptrend:
- Find the most recent swing low before my entry.
- Place my stop loss a few ticks or pips below that low.
For a downtrend:
- Find the most recent swing high.
- Place my stop loss a few ticks above that high.
This stop loss is my line in the sand. If price crosses it, I was wrong. I get out and live to trade another day. Even after I identify a trend in trading, I respect my stop.
Step 6: Trail Your Stop as the Trend Continues
Once I’m in profit, I don’t just set and forget. I let the trend work for me by moving my stop higher.
My trailing method:
- Every time price makes a new higher high, I move my stop up to the new most recent swing low.
- I never move my stop down. Only up (for longs) or down (for shorts).
- Eventually, price reverses and hits my stop. I get out with profit still in my pocket.
This is how professionals ride trends for weeks or months. They don’t predict the top. They let the trend tell them when it’s over.
Quick Recap – My Daily Cheat Sheet
| Step | Action |
|---|---|
| 1 | Choose timeframe (daily or 5-min) |
| 2 | Draw trendlines or EMAs to identify a trend in trading |
| 3 | Confirm ADX > 25 |
| 4 | Wait for pullback entry |
| 5 | Set stop below last swing low |
| 6 | Trail stop as trend continues |
Follow this workflow every single time. It won’t make you perfect. But it will make you consistent. And consistency is what turns a beginner into a profitable trader.
Conclusion
Let’s bring this home. Mastering how to spot a trend in trading changed everything for me. I stopped guessing and started trading with a real edge. By combining simple price action, moving averages, and the ADX, you can reliably spot a trend before it makes a major move. That’s the difference between consistent winners and gamblers.
Learning how to catch a trend in trading early through pullbacks and volume confirmation is where the real money is made. Don’t chase. Wait for your spot. And if you’re an active trader, understanding how to find trend in intraday trading using faster timeframes and noise filters like the ADX is absolutely essential.
No single method is perfect. I still take losses. But a systematic approach dramatically increases your odds. My advice? Start practicing on a demo account today. Build the muscle memory. Then go trade for real.
Frequently Asked Questions
What is the fastest way to identify a trend in trading?
The fastest way to identify a trend in trading is to look at the 200-period moving average on your chosen timeframe. Price above the line tells me we’re in an uptrend. Price below tells me it’s a downtrend. Simple as that. I can see it in about two seconds.
Can I spot a trend in trading using only one indicator?
Yes, but it’s risky. I’ve tried using just one indicator to spot a trend in trading, and I got burned by false signals more than once. Now I combine the ADX with trendlines or moving averages. Two tools are better than one.
How to catch a trend in trading without buying the top?
To catch a trend in trading without buying the top, I always wait for a pullback. My sweet spot is a retracement to the 20 or 50 EMA, or the Fibonacci 50% level. Then I look for a reversal candle. That’s how I enter early without chasing.
Is it harder to find trend in intraday trading than daily charts?
Yes, because of all the market noise. I’ve learned that to find trend in intraday trading, I need to use a higher intraday timeframe – 15 minutes instead of 1 minute. I also apply the ADX and only trade when it reads above 25. That filters out the chop.
What if I identify a trend in trading but the market reverses?
I always use a stop loss. No exceptions. Even when I correctly identify a trend in trading, reversals happen. News drops. Banks move price. My opinion doesn’t matter. A stop loss is my insurance. Risk management is non-negotiable.

