Bullish vs Bearish Hammer Pattern
Sellers push price down aggressively → liquidity hunt → buyers step in → rejection creates long wick.
Signal is valid only if next candle closes above Hammer high with momentum.
Stronger signals come with high volume on rejection candle.
Pattern fails if price breaks below Hammer low after formation.
• Entering without confirmation candle
• Trading in strong downtrend without reversal context
• Ignoring support/resistance zones
• Confusing random long wick with real Hammer structure
Let’s be real for a second: markets don’t move in straight lines. They zig, they zag, and every once in a while, they leave behind a single candle that tells you exactly where the tide is about to turn. That’s where the hammer pattern earns its stripes. Picture a small body parked at the top of the candle with a long, nasty-looking wick dangling below – like a hammer you’d find in a toolbox. This little guy shows up after a downtrend when sellers have been running the show all day, only to get completely shoved aside by buyers who step in and say, “not today.” By the time the candle closes, the selling attempt has been rejected, and the market is quietly hinting at a bullish reversal.
So what makes the hammer candle pattern worth your screen time? Simple: it’s one of the few single-candlestick signals that actually works across forex, crypto, and stocks without needing a PhD in technical analysis. The trick isn’t memorizing the shape, it’s knowing where it sits, what the volume is doing, and how to jump in with a real plan. This guide will walk you through everything from the psychology behind the wick to exact entry and exit rules, plus the nasty ways a hammer can fail if you get cocky. No fluff, no theory for theory’s sake, just the practical stuff you can use tomorrow morning.
What Is the Hammer Pattern? (Core Definition & Anatomy)
Alright, let’s get down to brass tacks. The hammer pattern isn’t some mysterious voodoo, it’s just a single candlestick with a very specific job description: signal a potential bullish reversal after a downtrend. But not every candle with a long lower wick gets to call itself a hammer. There are three hard-and-fast rules.
Rule #1: The lower wick must be massive. We’re talking at least twice the length of the real body. Some traders push for 2.5x or 3x. The longer the wick, the more violently buyers rejected the lows. That’s the soul of the hammer pattern psychology in a nutshell.
Rule #2: The real body sits at the top of the candle’s range. Picture a tiny box clinging to the ceiling. Whether it’s green or red doesn’t matter for the pattern itself – though we’ll get to the green hammer pattern vs red hammer pattern debate in a minute.
Rule #3: Little to no upper shadow. A small upper wick is fine. A long one? That’s a different animal entirely (hello, Inverted Hammer). The classic hammer candle formation wants price to open, drop like a rock, then rally hard to close near the high. No drama on top.
So what’s the hammer candlestick meaning in plain English? Sellers tried to run the show. They failed. Buyers stepped in, grabbed control, and slammed price back up. It’s a rejection candle – pure and simple.
Let’s look at a real example of hammer pattern to make this stick.
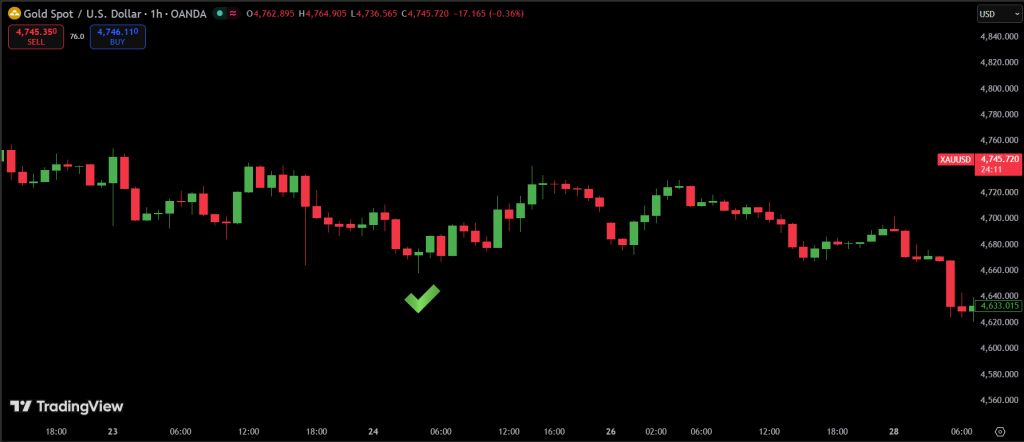
See how the candle dropped hard, then recovered to close near the open? That’s not an accident. That’s a battle that buyers won.
Now about color: a green hammer pattern means buyers actually pushed price above the open by the close – extra bullish sauce. A red hammer pattern means the candle closed slightly below the open, but still near the top of the range. Still valid. Still bullish. The green hammer candlestick pattern is technically stronger, but a red hammer with a massive wick works just fine.
So when someone asks “is hammer pattern bullish or bearish?” – the answer is clear: bullish hammer pattern all day, provided it appears after a downtrend. Put this same shape at the top of an uptrend, and you’ve got a Hanging Man (bearish). Context is everything.
The Psychology Behind the Hammer (Why It Works in Detail)
Let’s crawl inside the candle for a minute. Imagine you’re watching a stock, a crypto, or a forex pair that’s been getting hammered (pun intended) for days. The hammer pattern psychology isn’t magic – it’s pure mass emotion printed on a chart.
Here’s how the drama unfolds.
Act 1: The Sell-Off. The candle opens. Sellers smell blood and start shoving price down. Maybe there’s news. Maybe it’s just momentum. Either way, the crowd is panicking, stops are getting triggered, and it looks like another red day. This is the “long lower wick” being forged in real time.
Act 2: The Line in the Sand. Then something changes. Price hits a level where buyers decide enough is enough. Maybe it’s a hammer pattern at support, a previous low, a round number, or a trendline. Suddenly, bids start flooding in. The selling pressure gets absorbed. Then overpowered.
Act 3: The Comeback. Buyers shove price back up relentlessly. By the time the candle closes, the market is sitting near the top of the range. That tiny little body represents one thing: sellers had their chance and blew it.
That’s why the bullish hammer pattern carries weight. It’s not just a shape, it’s a story of rejection, exhaustion, and a power shift from the bears to the bulls.
Now, does the color matter for the psychology? Yes and no.
A green hammer pattern tells you buyers were so aggressive that they not only recovered the losses but pushed the close above the open. That’s confidence. That’s swagger.
A red hammer pattern tells a slightly different story: sellers still had enough juice to keep the close below the open, but buyers denied them a total victory. The red hammer candlestick pattern is still bullish, it just might need an extra confirmation candle the next day.
One last psychological gem: the longer the lower wick, the more violent the rejection. A long lower wick hammer with a tiny body is a scream from the market that the sellers are spent. Respect that scream.
Position & Context: Where Hammers Actually Work
Here’s where most traders mess up. They see a hammer and immediately hit “buy” without asking the most important question: where is this thing sitting?
The hammer pattern isn’t a magic wand. It’s a context machine. Put it in the wrong spot, and it’ll burn your account faster than a bad earnings play.
The Sweet Spot: Hammer Pattern at Bottom
This is home base. After a sustained downtrend, think four or more red candles in a row, a hammer pops up. That’s your hammer pattern at bottom. The sellers are exhausted. The buyers just served notice. This is the classic hammer pattern in downtrend setup that every textbook talks about.
The Power-Up: Hammer Pattern at Support Level
Now we’re cooking. When a hammer pattern at support level appears, meaning a previous low, a round psychological number, or a rising trendline, you’ve got confluence. Two reasons to believe instead of one. The hammer pattern at support is statistically more reliable than a hammer in open space.
The Danger Zone: Hammer Pattern at Top / Hammer Pattern in Uptrend
Listen closely: a hammer does NOT belong at the top of an uptrend. That shape after a rally? That’s not a hammer, that’s a Hanging Man (bearish reversal). So if you see a hammer pattern at top or a hammer pattern in uptrend, walk away. Better yet, consider a short position if other signals line up.
The Gray Area: Hammer Pattern at Resistance Level
A hammer pattern at resistance level is tricky. It means buyers tried to break through a ceiling and failed, but then recovered to close near the high. This can be a bull trap. Wait for a clear close above resistance before trusting it.
Timeframe Matters
A hammer pattern on daily chart is a solid signal. A hammer pattern on weekly chart is a monster, institutions leave those footprints. On the flip side, a hammer on a 5-minute chart during low liquidity? Noise. Just noise.
Hammer & Hanging Man — Market Context Guide
Advanced & Rare Hammer Variations
You’ve got the classic hammer down cold. Now let’s talk about the weird cousins that don’t show up every day but can print serious money when they do. These are the advanced & rare hammer variations that separate casual chart watchers from traders who spot gems others scroll right past.
Double Hammer Pattern
The double hammer pattern is exactly what it sounds like: two consecutive hammer candles kissing the same low. First hammer drops, recovers. Next candle does the exact same thing. Sellers attack twice. Buyers reject twice. That’s exhaustion on steroids.
Where does this work best? A double hammer pattern on top? No – that would be a double Hanging Man (extremely bearish). But a double hammer pattern at a support level after a downtrend? That’s a green light with a cherry on top. The market is basically screaming “we are NOT going lower.”
Double Inverted Hammer Pattern
The double inverted hammer pattern is rarer than a quiet day in crypto. Two inverted hammers in a row – both with long upper wicks and small bodies at the bottom. This tells a different story: buyers tried to rally twice during a downtrend, got smacked down twice, but kept showing up. It’s desperate buying pressure. When this appears, the breakout tends to be violent.
Doji Hammer Pattern
The doji hammer pattern is what happens when the body shrinks to almost nothing. Think of a doji (open = close) but with a long lower wick. Some call it a Dragonfly Doji. Others call it a doji hammer pattern. The distinction? A true doji hammer has an upper shadow as well – tiny, but present. The psychology is extreme indecision followed by rejection. It’s valid but usually needs a stronger confirmation candle than a regular hammer.
Hanging Hammer Pattern
Let’s clear up confusion around the hanging hammer pattern. Is this a thing? Sort of. Some traders use “hanging hammer” interchangeably with Hanging Man. Others use it to describe a hammer-shaped candle that appears after a short uptrend within a larger downtrend (a counter-trend bounce). The safer approach: treat hanging hammer pattern as a warning shot, not a trade signal. If you see it, zoom out.
How to Trade the Hammer Pattern (Complete Strategy)
Knowing how to spot a hammer is one thing. Knowing how to trade it without getting your face ripped off is another. Let’s build a real trading hammer pattern playbook.
Step 1: How to Identify the Setup
Look for a clear downtrend first. Lower lows and lower highs for at least five to ten candles. Then find a hammer with a long lower wick and a small body at the top. Check for support nearby like a previous low or a round number. That is your how to identify hammer candlestick pattern checklist.
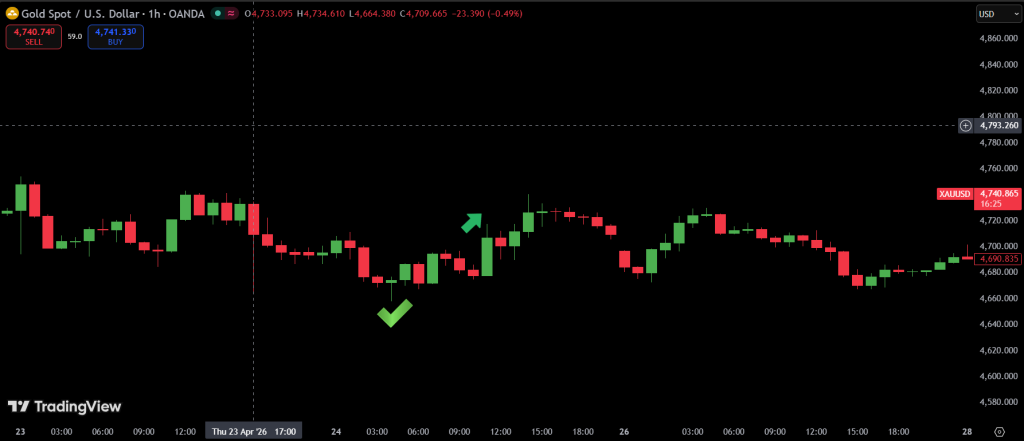
Step 2: Wait for Confirmation
Never buy the moment the hammer closes. That is a recipe for disaster. Hammer pattern confirmation means waiting for the next candle to close above the hammer’s high. No confirmation means no trade. Period.
Step 3: Choose Your Entry
Aggressive entry happens at the close of the confirmation candle. Conservative entry is a limit order set at the hammer’s high plus one pip. Beginners should stick with the conservative entry every time.
Step 4: Set Your Stop Loss
Place your stop loss just below the long lower wick hammer low. Give it a little breathing room. Forex needs five to ten pips below the wick. Crypto needs two to three percent below. If price breaks that low, the hammer pattern reversal has failed and you get out immediately.
Step 5: Pick Your Profit Targets
Your first target is the nearest swing high or resistance level. Your second target is two or three times your risk. Take partial profits at the first target and let the rest run with a trailing stop.
Success Rate & Reliability (What the Data Says)
Let’s talk numbers. You can have the prettiest hammer in the world, but if the success rate stinks, what’s the point? So let’s get real about the hammer pattern success rate.
Studies across forex, stocks, and futures show that a hammer with confirmation works about 60 to 65 percent of the time. That means six or seven trades out of ten go your way. That is solid for a single candle pattern. Without confirmation, that number drops below 50 percent. You might as well flip a coin.
So how reliable is the hammer pattern? It depends on three things. First, the strength of the downtrend before the hammer. The sharper the drop, the better. Second, the presence of support. A hammer pattern at a support level is more reliable than a hammer in open space. Third, volume. Higher volume on the hammer day means institutions are involved, not just retail traders.
A hammer pattern on a weekly chart is more reliable than a daily chart hammer. A daily hammer is more reliable than an hourly hammer. Timeframe matters because bigger players leave footprints on bigger charts.
What about the color? A green hammer candlestick pattern has a slightly higher success rate than a red hammer pattern. The difference is about five percent. Green shows buying pressure into the close. Red shows a late comeback that just barely fell short. Both work, but green is better.
The most reliable setup of all is a hammer pattern at support on a daily or weekly chart with above average volume and a green body. That combination pushes the success rate closer to 75 percent.
Here is the bottom line. The hammer pattern success rate is good enough to trade profitably if you follow your rules. But if you skip confirmation or ignore context, that number will eat your account alive. Respect the data.
Failures & False Signals (When Hammers Lie)
Let me save you some money right now. Hammers fail. They fail more often than most trading gurus admit. Knowing why they fail is just as important as knowing how to trade them.
Hammer Pattern Failure
A hammer pattern failure happens when price breaks below the low of the hammer after you take the trade. That long lower wick was supposed to be support. When it breaks, the whole thesis falls apart. Get out immediately. Do not wait. Do not hope. The market is telling you that buyers did not actually take control.
False Hammer Pattern
A false hammer pattern looks exactly like a real hammer but appears in the wrong context. The most common false hammer shows up in the middle of a consolidation range. Price is going nowhere. The hammer forms but there is no downtrend to reverse. This is not a signal. It is just noise. Another false hammer appears on low volume during a holiday session. Thin markets produce fake candles all the time.
Weak Hammer Pattern
What makes a weak hammer pattern? A tiny lower wick that barely meets the two to one rule is one answer. A huge body that takes up most of the candle is another. Some traders think a small body hammer candle is weak. Actually the opposite is true. The smaller the body, the more extreme the rejection. A weak hammer pattern comes from a wick that is not much longer than the body and a close that is not near the high. That candle has no conviction behind it.
Why Hammers Fail
The number one reason for failure is trading without confirmation. A hammer pattern without confirmation gets run over constantly. The second reason is ignoring the higher timeframe trend. A hammer that goes against the weekly trend has a much higher failure rate. The third reason is tight stops. If you put your stop loss inside the wick instead of below it, normal market noise will shake you out before the real move starts.
Limitations of Hammer Pattern
Here are the real limitations of hammer pattern trading. First, hammers work poorly in strongly bearish markets. One hammer cannot stop a freight train. You might need two or three before the trend actually turns. Second, hammers are less reliable in low liquidity assets like small cap stocks and obscure crypto tokens. Third, hammers tell you nothing about the target. You still need support and resistance levels to take profits.
One more limitation. The hammer pattern is a reversal signal but reversals take time. Do not expect price to rocket upward the next day. Sometimes the market sits on the hammer low for three or four days before moving. If you have no patience, trade something else.
The bottom line is this. Hammers are useful but not perfect. Respect the failures, understand the limitations, and you will survive long enough for the winners to pay off.
Market Specific Applications (Where to Trade)
The hammer pattern does not care what market you trade. But different markets have different personalities. Let me show you how the hammer behaves across forex, crypto, stocks, and day trading timeframes.
Hammer Pattern Forex
The hammer pattern forex traders love works beautifully on major pairs like EURUSD, GBPUSD, and USDJPY. These markets run 24 hours a day from Sunday night to Friday evening. The best hammer pattern forex setups appear on the daily and four hour charts during active trading sessions. London open and New York open produce the most reliable signals. Avoid trading hammers during the Asian session when liquidity is thin and fake candles are everywhere. A hammer pattern on forex charts at a key support level like a round number or a trendline is a high probability trade.
Hammer Pattern Crypto
Crypto moves fast and hits hard. The hammer pattern crypto traders use needs wider stops and stronger confirmation. Bitcoin and Ethereum are the most reliable for hammer trading. Small cap altcoins produce too many false hammer pattern signals because liquidity is low and manipulation is high. On a hammer pattern crypto daily chart, you want to see volume spike on the hammer day. That tells you the move is real. Because crypto is volatile, wait for two confirmation candles instead of one. Patience saves your account.
Hammer Pattern Stock Market
The hammer pattern stock market application works best on large cap liquid stocks like Apple, Microsoft, Amazon, and Google. These names have deep order books and institutional participation. A hammer candlestick pattern stocks setup on a daily chart at a major moving average like the 200 day line is a beautiful thing. Penny stocks and low volume small caps produce false hammers constantly. Avoid them. Index ETFs like SPY and QQQ are also excellent for hammer trading because they reflect broader market sentiment.
Hammer Pattern for Day Trading
Yes, you can trade the hammer pattern for day trading on smaller timeframes. The key is using the five minute or fifteen minute chart during the first two hours of the stock market open. That is when volume and volatility are highest. A hammer pattern for day trading needs faster confirmation. You cannot wait for the next candle to close because the move might be over. Instead, enter when price breaks the high of the hammer on strong volume. Keep your stop tight and your targets small. One to one risk to reward is fine for day trading. Do not hold overnight.
Comparisons – Hammer vs Similar Patterns
New traders get confused because the same shape can mean completely different things depending on where it sits. Let me clear up every single comparison so you never mix them up again.
Hammer Pattern vs Hanging Man
This is the most common mix up. The hammer pattern vs hanging man debate has a simple answer. They look identical. Both have a small body at the top and a long lower wick. The only difference is the trend before the candle. A hammer appears after a downtrend and signals a bullish reversal. A Hanging Man appears after an uptrend and signals a bearish reversal. Same candle. Opposite meaning. The difference between hanging man and hammer is purely context. One is your friend. One wants to take your money.
Hammer vs Inverted Hammer
The hammer vs inverted hammer comparison is about shape. A regular hammer has a long lower wick and a small body at the top. An inverted hammer has a long upper wick and a small body at the bottom. The psychology is different too. A regular hammer shows buyers rejecting lower prices. An inverted hammer shows buyers trying to rally but getting pushed back down. Both are bullish reversal signals after a downtrend. But the regular hammer is more reliable and needs less confirmation than the inverted hammer.
Hanging Man vs Hammer Pattern
When traders ask about hanging man vs hammer pattern, the answer is always the same. Look at the trend before the candle. If price has been falling, it is a hammer and you look for buys. If price has been rising, it is a Hanging Man and you look for sells or take profits on longs. Never trade a Hanging Man as a bullish signal. That mistake burns accounts every single day.
Shooting Star vs Hammer
The shooting star vs hammer relationship is upside down. A hammer has a long lower wick and sits at the bottom of a downtrend. A Shooting Star has a long upper wick and sits at the top of an uptrend. The Shooting Star is the bearish opposite of the hammer. If you understand the hammer, you already understand the Shooting Star. Just flip everything upside down.
Opposite of Hammer Pattern
The opposite of hammer pattern is the Shooting Star. One rejects lower prices after a downtrend. The other rejects higher prices after an uptrend. Some traders also call the bearish engulfing pattern an opposite, but the true visual opposite is the Shooting Star.
Quick Summary of All Comparisons
A hammer belongs at the bottom of a downtrend and is bullish. A Hanging Man belongs at the top of an uptrend and is bearish. An inverted hammer also sits at the bottom of a downtrend but has an upper wick instead of a lower one. A Shooting Star sits at the top of an uptrend and is the bearish twin of the inverted hammer. Memorize these four and you will never confuse them again.
The Final Verdict
Let me bring this all together for you. The hammer pattern is one of the most reliable single candlestick signals in technical analysis, but only when you use it correctly.
Here is what you need to remember. A hammer has a long lower wick and a small body at the top with little to no upper shadow. It must appear after a downtrend. That is non negotiable. The same shape after an uptrend is a Hanging Man, which is bearish and will wreck a bullish trade.
The psychology is simple. Sellers tried to push price down. Buyers stepped in and rejected those lows. By the close, the buyers had won the battle. The hammer pattern psychology is all about exhaustion of selling pressure and the beginning of a power shift.
Never trade a hammer without confirmation. Wait for the next candle to close above the hammer’s high. A hammer pattern without confirmation fails about half the time. With confirmation, your success rate jumps to sixty five percent or higher.
Place your stop loss below the long lower wick hammer low. That is your line of defense. If price breaks that low, the trade is wrong and you get out. No questions. No hope. Just exit.
Take partial profits at the first resistance level and let the rest run with a trailing stop. Risk management separates profitable traders from gamblers.
The hammer works across forex, crypto, and stocks. But each market has its own personality. Forex likes daily and four hour charts. Crypto needs wider stops and extra confirmation. Stocks work best on large cap names and index ETFs.
Watch out for failures. A false hammer pattern in the middle of a consolidation range will trick you. A weak hammer pattern with a tiny wick has no conviction. Understand the limitations of hammer pattern trading before putting real money on the line.
The hammer pattern as a reversal pattern is a tool, not a magic wand. It will not make you rich overnight. But used correctly with proper rules and risk management, it will stack winning trades over time.
Now go look at your charts. Find a downtrend. Spot a hammer. Wait for confirmation. Place your stop. Take your profit. That is how you trade the hammer pattern.
FAQ
What does a hammer candlestick indicate?
A hammer candlestick indicates that sellers pushed price down during the trading period but buyers stepped in and pushed price back up to close near the high. This rejection of lower prices suggests that the downtrend may be ending and a bullish reversal could be coming.
Is a red hammer candlestick bullish?
Yes, a red hammer candlestick is still bullish. The red hammer pattern means the candle closed slightly below its open, but the long lower wick still shows strong buying pressure. A green hammer is stronger, but a red hammer with a very long wick works just fine as a reversal signal.
What is the difference between a hanging man and a hammer pattern?
The difference between hanging man and hammer pattern is the trend before the candle. A hammer appears after a downtrend and is bullish. A Hanging Man appears after an uptrend and is bearish. The candle shape is exactly the same. Only the context changes.
What does an inverted hammer pattern indicate?
An inverted hammer pattern indicates that buyers tried to push price higher during the trading period but got rejected, yet they still managed to close near the high of the candle. In a downtrend, this shows buying effort and can lead to a bullish reversal. It needs stronger confirmation than a regular hammer.
Can I trade the hammer pattern alone without confirmation?
You can, but you should not. A hammer pattern without confirmation has a success rate below fifty percent. That is worse than flipping a coin. Always wait for the next candle to close above the hammer’s high before entering a trade.
What is a double hammer pattern?
A double hammer pattern is two consecutive hammer candles at the same support level. This shows extreme selling exhaustion and multiple rejections of lower prices. It is a very strong bullish signal when it appears after a downtrend.
How reliable is the hammer pattern on weekly charts?
The hammer pattern on weekly charts is highly reliable. Weekly charts filter out daily noise and show what large institutions are doing. A weekly hammer at a major support level with confirmation has a success rate above seventy percent.
What makes a false hammer pattern?
A false hammer pattern looks like a real hammer but appears in the wrong context. Common false hammers show up in the middle of a consolidation range, on low volume during holiday sessions, or after a very short downtrend of only one or two candles. Always check the trend and volume.
Is there a bearish hammer pattern?
No, there is no bearish hammer pattern. A hammer is by definition a bullish reversal signal after a downtrend. The same shape after an uptrend is called a Hanging Man, which is bearish. Some traders mistakenly call that a bearish hammer, but that is incorrect terminology.
What is the opposite of hammer pattern?
The opposite of hammer pattern is the Shooting Star. A hammer has a long lower wick and appears after a downtrend. A Shooting Star has a long upper wick and appears after an uptrend. One rejects lows. The other rejects highs.

