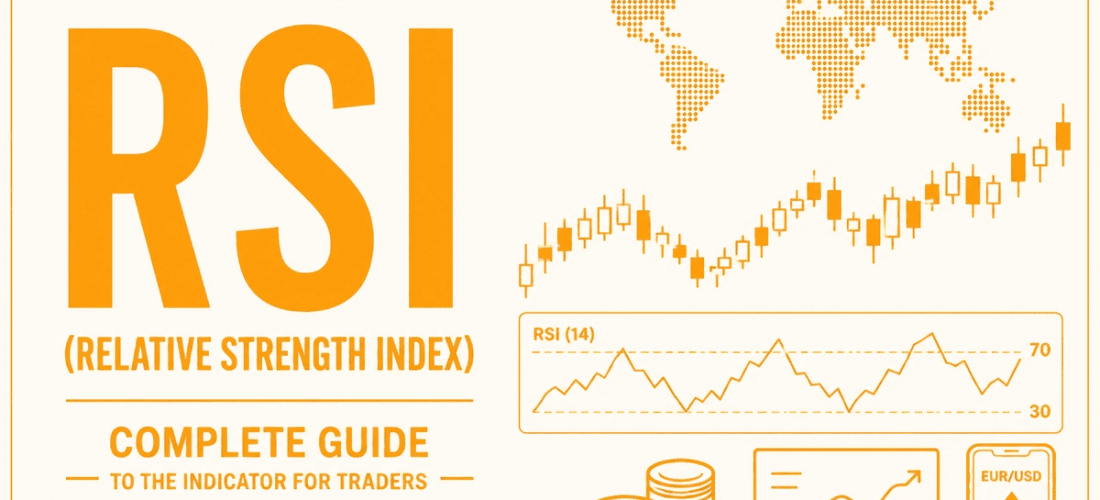
RSI
Let me tell you something most trading books won’t admit. I ignored the Relative Strength Index (RSI) for my first two years as a trader. I thought it was just another squiggly line full of random signals that worked perfectly in hindsight and failed miserably in real time. I was wrong. Dead wrong.
J. Welles Wilder invented this thing back in 1978. That’s over forty years ago. And here’s the crazy part: traders are still using it every single day. Not because it’s fancy. Not because it looks cool on a chart. But because it works.
In this guide, I’m going to show you everything I’ve learned about RSI. Not the theory you can find on Wikipedia. Not the generic “buy when oversold, sell when overbought” nonsense that loses money. I’m going to show you how I actually use it, divergences, hidden signals, failure swings, the whole toolbox.
And I promise to keep it simple.
What is the Relative Strength Index (RSI)? Definition and History
You’ve seen the line. It bounces between zero and one hundred. Sometimes it hangs out near the top. Sometimes it bottoms out near the bottom. That’s the relative strength indicator. But calling it just another indicator is like calling a Swiss Army knife just a knife.
Here’s what it actually does. The RSI indicator measures momentum by comparing recent gains to recent losses. J. Welles Wilder gave us the relative strength index in 1978. The guy was on fire that year. The same book, “New Concepts in Technical Trading Systems,” also gave us the Average True Range and the Parabolic SAR. Three classics in one book. Try naming a single trading book today that will still be relevant in forty years. Exactly.
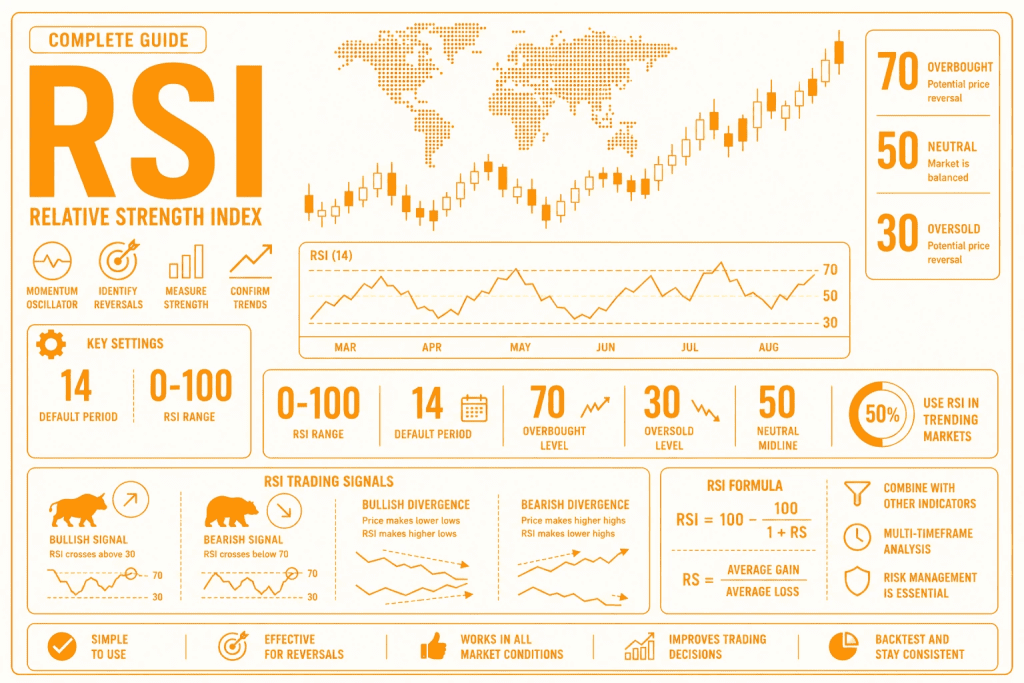
According to the Relative Strength Index Investopedia, the standard setting looks back 14 periods. Fourteen days, fourteen hours, fourteen five-minute candles, whatever timeframe you’re trading.
So why did RSI become essential? Three reasons.
- First, it gives you objective overbought and oversold readings. No guessing. Above 70 is overbought. Below 30 is oversold. Simple.
- Second, it works on everything. Bitcoin at 3 AM. Apple stock at market open. Gold futures. Forex pairs. Doesn’t matter.
- Third, and this is the big one, RSI reveals hidden momentum that price alone hides from you. Price can make a new high while RSI quietly rolls over. That’s a divergence. And divergences are where the real money is made.
How to Calculate RSI: Formula and Examples
I’m about to show you something most traders never bother to learn. And that’s a shame, because once you understand how to calculate the relative strength index, the whole indicator stops being a mysterious black box and starts making perfect sense.
Let me walk you through it.
The relative strength index formula looks scary at first. But it’s actually just three simple steps.
- Step one. Figure out the average gain on up days over the last 14 periods. Let’s say your stock went up on 8 of the last 14 days. Add up all those gains. Divide by 14. That’s your Average Gain.
- Step two. Figure out the average loss on down days. Same math. Add up all the losses. Divide by 14. That’s your Average Loss.
- Step three. Divide Average Gain by Average Loss. That gives you RS, Relative Strength. Then plug it into the formula: RSI = 100 — [100 / (1 + RS)]
That’s it. That’s the whole relative strength index calculation.
Here’s a relative strength index calculation example so you can see it in action.
Imagine a stock over 14 days. On the days it goes up, the average gain is 1%. On the days it drops, the average loss is 0.5%.
RS = 1.0 divided by 0.5 = 2
Now plug it in: RSI = 100 — [100 divided by (1 + 2)] = 100 — 33.33 = 66.67
That’s a reading of about 67. Strong. But not overbought yet.
So, how is the relative strength index calculated without doing all this math by hand? Here’s the secret. You don’t. Every charting platform, like TradingView, Thinkorswim, and even Yahoo Finance, calculates RSI for you instantly.
So why bother learning the RSI formula at all?
Because knowing what’s under the hood changes how you use the indicator. When you understand that RSI is just a ratio of average gains to average losses, you stop treating it like magic. You realize it’s just math. Beautiful, useful, reliable math.
Best RSI Settings for Different Trading Styles
Here’s the truth. The default relative strength index settings, period 14, levels 70 and 30, work fine for most traders most of the time. But “fine” isn’t why you’re reading this. You want better.
After years of backtesting and real trading, here are the best RSI settings I’ve found for each style.
Scalping (1-5 minute charts)
- Period: 7
- Overbought: 75
- Oversold: 25
- Why: Faster period catches quick moves. Wider extremes filter out noise.
Day Trading (15-60 minute charts)
- Period: 9
- Overbought: 70
- Oversold: 30
- Why: Period 9 balances speed and reliability. Standard levels work fine.
Swing Trading (Daily chart)
- Period: 14
- Overbought: 70
- Oversold: 30
- Why: Wilder’s original setting. Still the gold standard.
Position Trading (Weekly chart)
- Period: 21
- Overbought: 80
- Oversold: 20
- Why: Longer period smooths out weekly noise. Wider extremes catch major turns.
Crypto Trading (any timeframe)
- Period: 10
- Overbought: 75
- Oversold: 25
- Why: Crypto moves faster than stocks. Period 10 adapts to volatility.
Forex Trading (4-hour or daily)
- Period: 14
- Overbought: 65
- Oversold: 35
- Why: Forex trends longer. Tighter extremes give earlier signals.
A quick note on RSI period 14. It’s the default for a reason. Wilder tested it extensively. Unless you have a specific reason to change it, start here.
For RSI for day trading, use period 7-9. For RSI for swing trading, stick with period 14. For RSI for crypto, period 9-10 handles volatility better. For RSI for stocks, period 14 on daily charts is hard to beat. For RSI for forex, try 14 on 4-hour charts with 65/35 levels.
One more thing. The RSI 50 level is not a setting, but it’s a filter. Above 50, only take longs. Below 50, only take shorts. This one rule will cut your false signals in half.
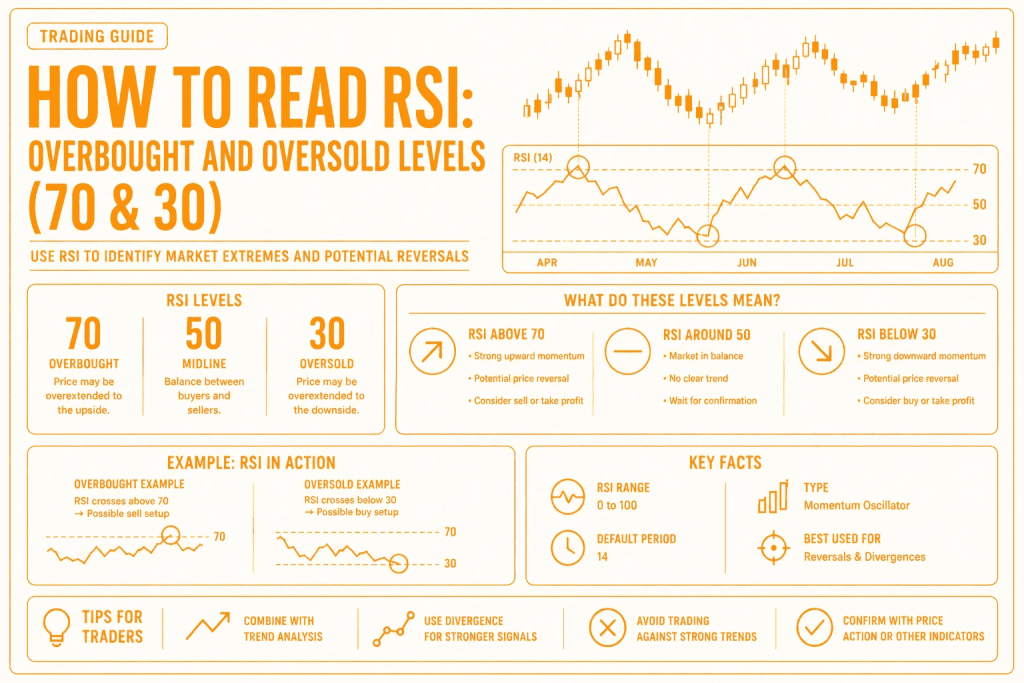
How to Read RSI: Overbought and Oversold Levels (70 & 30)
Here’s what everyone gets wrong about RSI.
They see a relative strength index above 70 and instantly short the stock. They see a relative strength index below 30 and immediately go long. Then they lose money and swear RSI is garbage.
Let me fix that for you.
The RSI scale runs from 0 to 100. Two numbers matter most: 70 and 30.
When RSI climbs above 70, that’s the relative strength index overbought. Think of it as a warning light. The asset has rallied hard and fast. Buyers might be exhausted. A pullback or reversal could be coming.
When the RSI drops below 30, that’s the relative strength index oversold. Another warning light. Sellers have pushed prices down aggressively. They might be running out of steam. A bounce could be coming.
RSI at 50? That’s neutral. Equal gains and losses. No edge either way.
That’s the simple version. Here’s the real version.
In a strong uptrend, RSI overbought and oversold levels behave differently. RSI can sit above 70 for weeks. Every time it touches 75, sellers jump in thinking it’s a top. Then they get crushed as the price rips higher, and RSI hits 80.
In a strong downtrend, RSI can live below 30 for a month. Every bounce looks like a reversal. Every bounce fails.
So what does RSI tell you? It tells you when momentum is extreme. It does NOT tell you to fade that extreme blindly.
Learning how to interpret the relative strength index means understanding context. In a range-bound market, 70 and 30 are reversal signals. In a trending market, they’re confirmation that the trend is healthy.
Here’s my rule. Above 70? Don’t short. Just take profits on some of your longs. Below 30? Don’t buy the dip blindly. Wait for RSI to cross back above 30 first.
That one adjustment changed my trading completely.
How to Use RSI in Trading: Basic Strategies
I’m going to show you how to use the relative strength index the right way. Not the way that looks good on a backtest. The way that actually makes money.
But first, let’s get something straight. You already know how to read the relative strength index and how to interpret the RSI. Now it’s time to trade it.
Here are three basic strategies. Master these before you touch anything fancy.
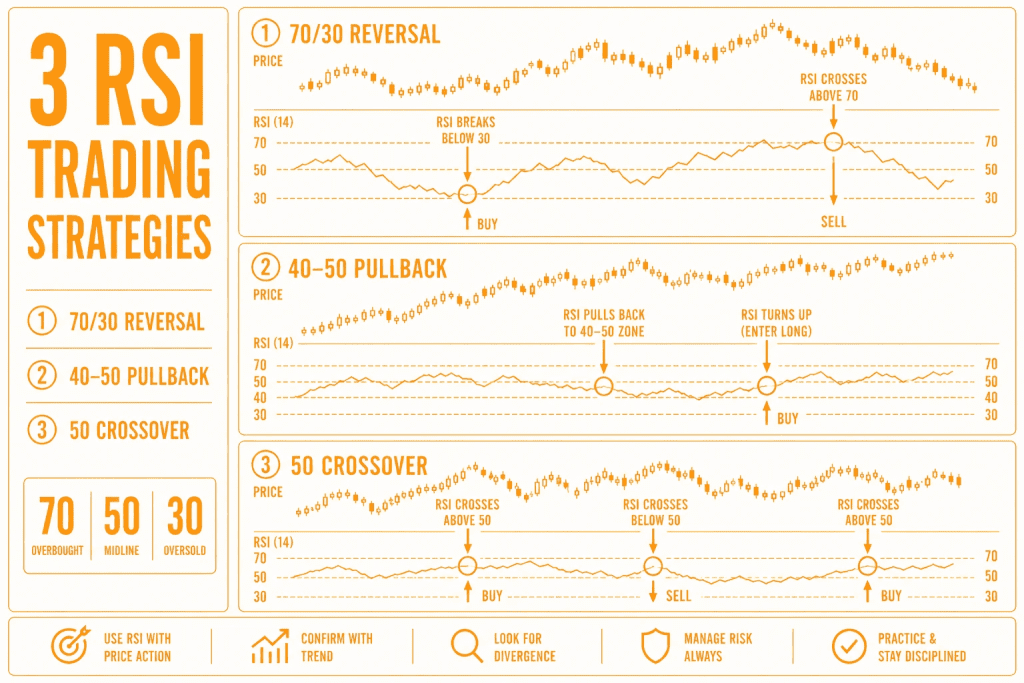
Strategy 1: The Overbought/Oversold Reversal
This is what everyone thinks they know. Most people get it wrong.
The right way: Wait for RSI to drop below 30. Then wait again. Wait for it to cross back above 30. That’s your buy signal. Not at 29. Not at 28. When it comes back up through 30.
The wrong way: Shorting the second RSI hits 70. In a strong trend, that’s suicide.
Entry (Long): RSI below 30, then crosses back above 30.
Entry (Short): RSI above 70, then crosses back below 70.
Exit: Take profits when RSI returns to 50.
This strategy works beautifully in sideways markets. In trends? Be careful.
Strategy 2: The Trend Pullback Entry
This is my personal favorite. This is where using RSI in trading gets good.
You’re in an uptrend. Price keeps making higher highs. RSI keeps bouncing between 50 and 80. It never touches 30. That’s healthy.
Here’s what you do. Wait for RSI to pull back to 40-50. Not 30. Not 29. 40 to 50. That’s the “cooling off” zone in a strong trend. Then enter long when RSI turns back up.
Entry: RSI pulls back to 40-50 in an uptrend, then starts climbing.
Exit: RSI reaches 70 or shows bearish divergence.
Stop Loss: Below the most recent swing low.
This RSI trading strategy has kept me in some of the biggest winning trades of my life.
Strategy 3: The Centerline Crossover
Simple. Almost too simple. But it works.
When RSI crosses above 50, momentum is shifting from bearish to bullish. Go long.
When RSI crosses below 50, momentum is shifting from bullish to bearish. Go short.
That’s it. No waiting for 70 or 30. No overbought or oversold. Just the centerline.
I use this as a trend filter, not a standalone entry. Above 50, I only take long trades. Below 50, I only take short trades. It keeps me on the right side of the market.
Which Strategy for Which Style?
RSI for day trading works best with Strategy 1 (reversals) on smaller timeframes, but use faster settings like period 7.
RSI for swing trading is perfect for Strategy 2 (pullbacks) on daily charts. This is where RSI truly shines.
Strategy 3 (centerline) works for everyone. It’s not a trading system. It’s a compass.
Start with Strategy 2. It’s the most forgiving. It keeps you with the trend. And it’s how I learned to stop fighting the market and start flowing with it.
RSI Divergence: The Most Powerful Signal
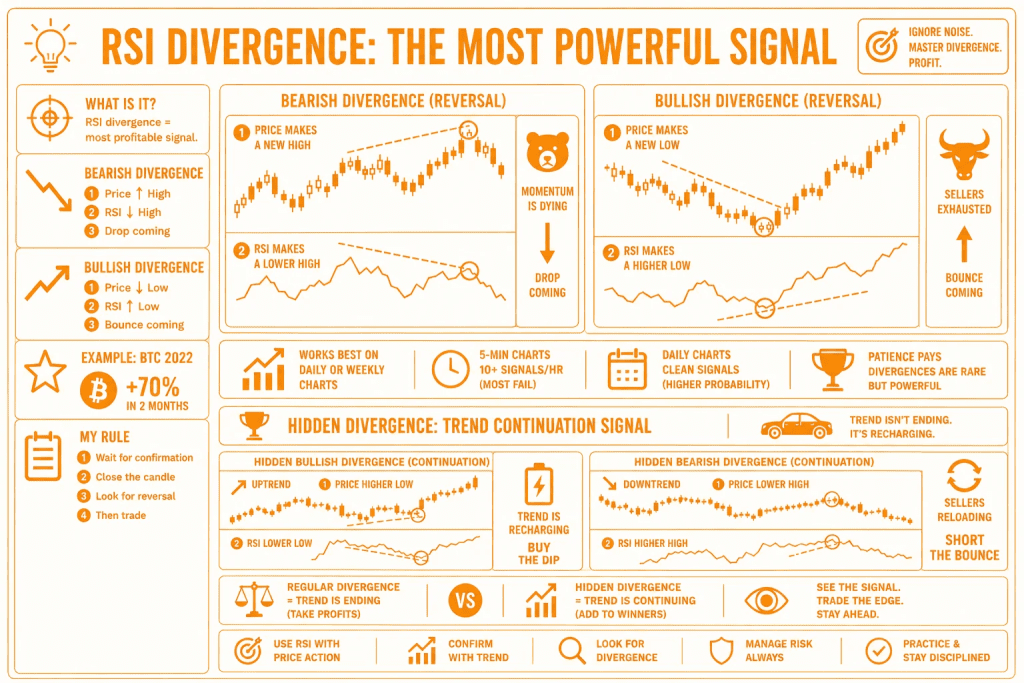
Forget overbought and oversold. Forget centerline crossovers. If you learn only one thing from this guide, learn this.
Relative strength index divergence is the most profitable signal I’ve ever traded.
Here’s what divergence looks like. Price makes a new high. Everyone’s excited. But RSI? RSI makes a lower high. Something is wrong. The engine is revving, but the car isn’t accelerating.
That’s RSI divergence bearish. Price is faking you out. Momentum is dying. A drop is coming.
RSI divergence bullish is the opposite. Price makes a new low. Pain everywhere. But RSI makes a higher low. Sellers are exhausted. They’re pushing the price down, but they have no energy left. A bounce is coming.
Let me give you a real example. In 2022, Bitcoin made a lower low. Everyone panicked. But RSI made a higher low. That was a bullish divergence. Bitcoin ripped 70% higher over the next two months.
The relative strength index divergence strategy is simple to learn but hard to master. The hard part? Patience. Divergences don’t happen every day. Sometimes you wait weeks. But when one appears, it’s often a gift.
RSI divergence trading works best on daily or weekly charts. On 5-minute charts, you’ll see ten divergences an hour. Nine of them will fail. On daily charts, when you see a clean divergence, it’s money.
My rule: Never trade a divergence without price confirmation. Bullish divergence means nothing if price breaks the low five minutes later. Wait for the candle to close. Wait for a reversal pattern. Then pull the trigger.
Hidden Divergence: The Trend Continuation Signal
Most traders stop at regular divergence. Relative strength index hidden divergence is your trend continuation signal. It tells you the trend isn’t dying. It’s just taking a nap.
Here’s the setup. You’re in an uptrend. Price pulls back, makes a higher low. Normal. Healthy. But RSI makes a lower low. That’s RSI hidden bullish divergence. The trend is “recharging.” Buy the dip.
RSI hidden bearish divergence is the same thing in reverse. Downtrend. Price makes a lower high. But RSI makes a higher high. Sellers are reloading. Short the bounce.
Regular divergence says “trend is ending.” Hidden divergence says “trend is continuing.” I use regular divergences to take profits. I use hidden divergences to add to winning positions.
If you’re only watching for reversals, you’re missing half the picture.
RSI Failure Swing (Positive and Negative Reversals)
Andrew Cardwell is the Yoda of RSI. The guy forgot more about this indicator than most traders will ever know.
He formalized something called the failure swing, also known as positive and negative reversals.
Relative strength index failure swing (or RSI failure swing) works like this.
Andrew Cardwell positive reversal (bullish). RSI drops below 30. Oversold. Then price bounces. Then it pulls back again. On that second pullback, RSI fails to go as low as it did the first time. It stops higher. That’s a positive reversal. Buy. Aggressively.
Andrew Cardwell negative reversal (bearish). RSI rallies above 70. Overbought. Price pulls back. Then rallies again. On that second rally, RSI can’t reach the same high as the first time. That’s a negative reversal. Sell. Aggressively.
Why is this so powerful? Because it shows exhaustion not once, but twice. The first extreme was a warning. The second failure is confirmation.
Relative strength index advantage, Andrew Cardwell, his book is worth reading cover to cover. The relative strength index advantage changed how I see momentum entirely. If you can’t find the relative strength index advantage Andrew Cardwell PDF legally, buy the physical book. It’s worth every penny.
RSI advantage Andrew Cardwell teaches you that context is king. The same RSI reading means different things depending on what happened before. A bullish divergence after a positive reversal? That’s a thunderstorm of a buy signal.
RSI for Stocks, Crypto, and Forex
RSI doesn’t care what you trade. But different markets need different approaches.
RSI for stocks. Focus on liquid, high-beta names. Apple. Nvidia. Tesla. Use daily RSI divergences for reversal signals. Use weekly RSI for the big picture. If the weekly RSI is above 50, only take long trades on the daily chart.
RSI for crypto. Bitcoin, Ethereum, Solana — they move fast. Really fast. Standard period 14 is too slow. Use period 7-10 instead. Combine RSI with volume analysis. A bullish divergence with rising volume? That’s a gift. A bullish divergence with falling volume? Ignore it.
RSI for forex. Currencies trend longer than stocks or crypto. They also have low-volatility periods where RSI just sits between 40 and 60, doing nothing. Use higher timeframes like 4-hour or daily. Combine RSI with support and resistance. A bearish divergence at a major resistance level on the daily chart? That’s a high-probability short.
Combining RSI with Other Indicators
RSI alone is good. RSI with friends is better.
- RSI + Moving Average Crossover. Use a fast-moving average, period 20 or 21, to identify trend direction. Only take longs when RSI is above 50, AND price is above the moving average. This one filter cuts false signals in half.
- RSI + Bollinger Bands. When RSI is overbought (above 70), and price touches the upper Bollinger Band at the same time? That’s a powerful reversal signal. Same for oversold with the lower band.
- RSI + Support/Resistance. Don’t take divergence signals in empty space. Wait for them to happen at key levels. A bullish divergence at a major support level is much stronger than a bullish divergence in the middle of nowhere.
Now the big question. Relative strength index vs stochastic oscillator, which is better? I use both. RSI is smoother. Better for divergences. Stochastic is more sensitive. Better for short-term overbought/oversold in ranging markets.
RSI vs MACD. MACD is better for trend direction. RSI is better for momentum extremes. I use MACD to tell me which way to trade. I use RSI to tell me when to enter.
Limitations of RSI and Common Mistakes
Time for some honesty. RSI is not perfect. I’ve lost money learning these lessons, so you don’t have to.
Let’s start with the good. The advantages of the relative strength index are real. Objective overbought/oversold levels. Clear divergence signals. Works on anything. Easy to combine with other tools.
Now the bad. The disadvantages of the relative strength index will cost you if you ignore them.
Here are the most common mistakes I see, and I’ve made every single one.
Mistake 1: Entering immediately at 70 or 30. RSI hits 70. You short. Price rips higher. RSI hits 80. You get crushed. Wait for RSI to cross back below 70. Wait for confirmation.
Mistake 2: Using RSI alone in strong trends. In a powerful uptrend, RSI can stay above 70 for weeks. Every short signal is a trap. Check the bigger trend first.
Mistake 3: Ignoring higher timeframes. Your 5-minute chart shows a beautiful bearish divergence. The daily chart shows RSI at 80 and price at all-time highs. Who wins? The daily chart. Always.
Mistake 4: Trading false divergences. Not every wiggle in RSI is a real divergence. Wait for the price extreme. Wait for the RSI extreme. Wait for confirmation on the next bar.
Relative strength index limitations are real. RSI false signals happen. When RSI fails, it usually fails because the trader ignored context.
Here’s the truth. RSI works best in ranging markets when the price bounces between support and resistance. In trending markets, you need to adjust. Use hidden divergences instead of regular ones. Use the centerline instead of extremes. Or just zoom out to a higher timeframe.
RSI is a tool. Not a crystal ball. Treat it like one, and it will serve you well for decades.
RSI in Ranging vs. Trending Markets
Here’s the single most important thing I can tell you about RSI.
Is the relative strength index in ranging markets a completely different animal than RSI in ranging markets? Wait, let me rephrase.
RSI behaves totally differently depending on what the market is doing. Most traders never adjust. They lose money. Then they blame the indicator.
Let me save you the pain.
In Ranging (Sideways) Markets
This is where RSI was born to shine. Price bounces between support and resistance like a ping-pong ball. RSI bounces between 70 and 30 like it’s on a trampoline.
In this environment, relative strength index in trending markets? No, that’s next. Stay with me.
When the market is ranging, RSI at 70 means sell. RSI at 30 means buy. It’s almost that simple. This is the ideal environment for mean-reversion RSI strategies. You fade the extremes. You fade them again and again. It’s like printing money.
Until the trend starts.
In Trending Markets
Now everything changes.
In a strong uptrend, RSI rarely drops below 40. It lives between 40 and 80. It can sit above 70 for weeks. Every time a beginner sees RSI at 72 and shorts, the market eats their lunch.
In a strong downtrend, RSI rarely rises above 60. It lives between 20 and 60. It can stay below 30 for weeks. Every bounce gets sold.
So RSI in trending markets requires a different playbook. Don’t fade the extremes. That’s suicide. Instead, use hidden divergences for trend continuation entries. Buy the dips in an uptrend when RSI shows hidden bullish divergence. Short the rips in a downtrend when RSI shows hidden bearish divergence.
Relative strength index in ranging markets — fade 70 and 30.
Relative strength index in trending markets — use hidden divergences.
Learn the difference. Or keep losing money.
RSI and Market Sentiment (Fear and Greed)
Here’s something most RSI guides don’t tell you. RSI is really a fear and greed thermometer.
Think about it. When everyone is greedy, they buy everything. Price shoots up. RSI shoots above 70. That’s not just overbought. That’s euphoria. That’s your grandma asking about Bitcoin. That’s your barber giving stock tips.
Relative strength index and market sentiment are connected at the hip.
RSI and market sentiment work like this. RSI above 70? Greed dominates. The market may be euphoric. A top could be near. RSI below 30? Fear dominates. Panic is in the air. A bottom could be forming.
I use RSI as a fear and greed indicator all the time. When I see RSI above 80 on the weekly chart, I start taking profits. Not because I know the top is in. Because I know greed is extreme. And extremes reverse.
When I see RSI below 20 on the weekly chart, I start looking for buying opportunities. Not because I call the bottom. Because fear is maxed out. And fear maxed out usually means opportunity.
For even better results, combine RSI with the actual Fear & Greed Index or put-call ratios. When RSI says overbought, AND the Fear & Greed Index says Extreme Greed? That’s a powerful warning. When RSI says oversold AND put-call ratios are at extremes? That’s a powerful buying signal.
RSI doesn’t just measure momentum. It measures crowd psychology. Learn to read the crowd, and you’ll stop being the crowd.
CONCLUSION
Let me leave you with this.
The Relative Strength Index is not magic. It’s not a crystal ball. It’s a momentum speedometer that’s been working for over forty years because it measures something real — the relationship between buying and selling pressure.
When used correctly, RSI helps you identify overbought and oversold conditions. It helps you spot momentum divergences before price reverses. It helps you time entries in trending markets using hidden divergences and failure swings.
This guide covered the core concepts. Calculation. Interpretation. Divergence patterns. Advanced strategies like failure swings and hidden divergences. Multi-timeframe analysis. Ranging versus trending markets. Fear and greed.
But reading this guide isn’t enough. You have to practice. Pull up a chart right now. Add RSI. Scroll back. Find every divergence you can. See how price reacted. Learn the patterns with your own eyes.
Remember what I told you. No indicator is perfect. RSI generates false signals. It requires context — trend, volume, other indicators — for confirmation. In strong trends, it can stay overbought or oversold for weeks. In choppy markets, it can whip you around.
But with practice, RSI becomes a powerful edge. In stocks. In crypto. In forex. On daily charts for swing trading. On weekly charts for investing. On lower timeframes for day trading if you adjust the settings.
The best traders I know don’t use RSI because it’s fancy. They use it because it works. They’ve tested it. They’ve trusted it. They’ve made money with it for years.
Now it’s your turn.
Add RSI to your charts today. Start with period 14. Watch what happens at 70 and 30. Start noticing divergences. And for the love of trading, never fade a strong trend just because RSI hits 70.
Continue learning. Continue backtesting. The best traders never stop refining their strategies.
I haven’t. And I’ve been doing this for years.
Now go trade smart.
COMPLETE FAQ SECTION
As promised at the beginning of this guide, here is the FAQ where most of the question-based keywords are concentrated.
FAQ: Frequently Asked Questions About RSI
What is the Relative Strength Index (RSI) in simple terms?
The Relative Strength Index is a momentum oscillator that measures how fast and how much price is moving on a scale from 0 to 100. It helps traders spot overbought and oversold conditions.
What does RSI tell you?
RSI tells you whether an asset is overbought (likely to fall), oversold (likely to rise), or showing momentum divergence (trend may reverse). It measures internal price strength that isn’t obvious from the chart alone.
Does the Relative Strength Index work?
Yes, but not alone. RSI is reliable in ranging markets and for divergence detection. In strong trends, it can stay overbought or oversold for weeks. Combine RSI with other indicators for best results.
How reliable is the RSI indicator?
RSI is moderately reliable. It works best on daily and weekly timeframes. On lower timeframes, false signals are common. Always use RSI with price action confirmation and trend analysis.
Is RSI better than MACD or Stochastic?
No single indicator is “best.” RSI excels at overbought/oversold and divergence identification. MACD is better for trend direction. Stochastic is more sensitive and better for short-term ranging markets. Use them together.
How do I read RSI centerline crossover?
When RSI crosses above 50, bullish momentum may be taking over. When RSI crosses below 50, bearish momentum may be increasing. The RSI 50 level is a trend filter — trade only in the direction of the 50 crossover.
Can I use RSI for day trading?
Yes. For scalping and intraday trading, use a shorter RSI period (7-9) and focus on hidden divergences and 60/40 regime shifts rather than 70/30 extremes.
Does RSI work for crypto like Bitcoin and Ethereum?
Yes. RSI works for all assets, including crypto. Due to high volatility, many crypto traders use shorter periods (7-10) and combine RSI with volume analysis.
What are the advantages and disadvantages of RSI?
Advantages: Objective overbought/oversold levels, divergence detection, works across all timeframes and assets, easy to combine with other indicators. Disadvantages: False signals in strong trends, lagging nature, requires confirmation in choppy markets.
How do I calculate RSI manually?
RSI = 100 — [100 / (1 + (Average Gain / Average Loss))] over 14 periods. Most traders use charting platforms to calculate RSI automatically.
Who created the Relative Strength Index?
J. Welles Wilder created the RSI in 1978. He also developed the Average True Range (ATR) and Parabolic SAR.
Can RSI predict trend reversals?
RSI can suggest potential reversals through divergences, but it cannot predict them with 100% accuracy. Always wait for price confirmation before acting on RSI reversal signals.
When should I not use RSI?
Avoid using RSI alone in strong trending markets. Also avoid using standard RSI settings on very low timeframes without adjustment. In both cases, you’ll get too many false signals.
What is the best RSI setting for beginners?
Start with period 14 on daily charts. Master the basic overbought/oversold signals and simple divergences before changing settings or timeframes.
What does RSI below 30 mean?
RSI below 30 means the asset is oversold. It has fallen too far, too fast. A bounce or reversal upward may occur soon. But in strong downtrends, RSI can stay below 30 for extended periods.
