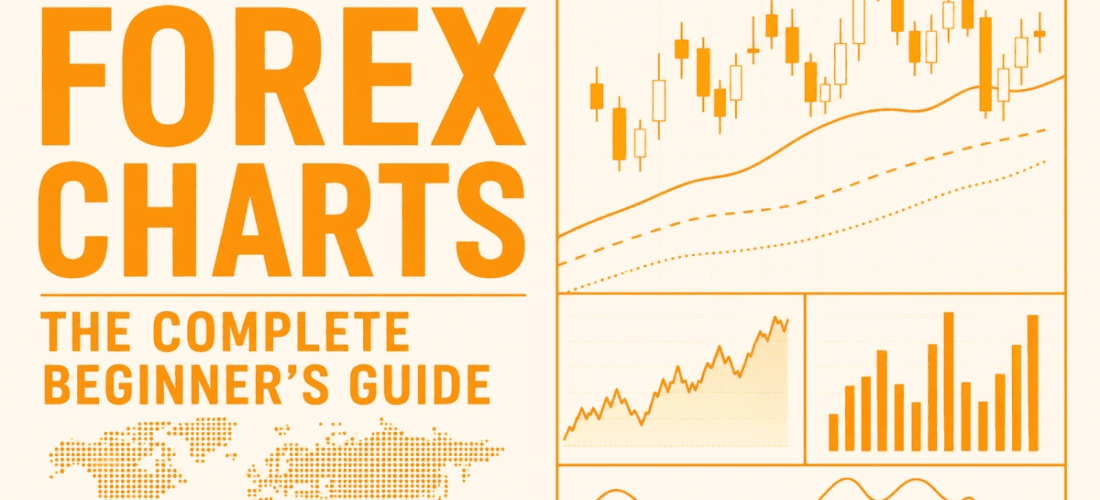
How To Read Forex Charts
Let me throw you a lifeline right off the bat: if you want to survive in currency trading, you first need to know how to read forex charts. Without that skill, you’re basically navigating a minefield blindfolded.
The good news? Once you wrap your head around a few core ideas, those squiggly lines start telling a story. In this guide, I’ll give you the naked truth about forex trading charts explained like you’re sitting right next to me.
What Are Forex Charts? (The Bird’s-Eye View)
Before you can learn how to read forex charts, you need to know what you’re staring at. A forex chart isn’t some mysterious voodoo board. It’s nothing more than a map of greed and fear. Every dot, every wick, every candle shows you what real people did with real money. No magic. No secret sauce.
Think of it as a battlefield snapshot. The bulls (buyers) and bears (sellers) are duking it out on every single candle. Your job? Figure out who’s winning before placing your bet.
The cold hard truth? The skill of being able to read forex charts separates winners from gamblers. If you can’t read forex trading charts, you’re not trading — you’re hoping. And hope is a terrible strategy. It’ll burn a hole in your account faster than a blowtorch through butter.
Here’s the kicker: reading forex charts isn’t rocket science. It’s pattern recognition. It’s seeing the same setups over and over until they jump off the screen and smack you in the face. A carpenter doesn’t stare at a hammer wondering what it does. And once you’ve spent a few weeks looking at price action, you won’t stare at a chart wondering what it’s telling you either.
So take a deep breath. You’ve got this. Let’s dig into the different flavors of charts next.
All Known Types of Forex Charts
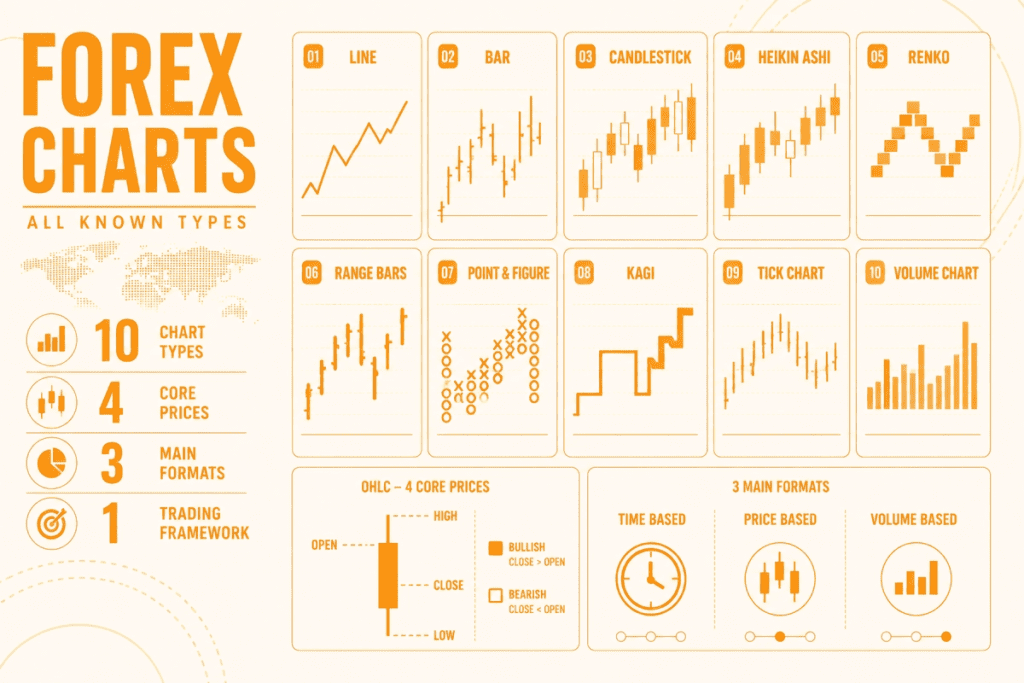
Whether you’re trying to learn how to read forex charts on TradingView or MetaTrader, you’ll run into several flavors. Some you’ll use every day. Others you’ll glance at once and forget. But knowing they exist? That’s what separates a curious trader from a clueless one. Forex trading charts explained properly will save you months of head-scratching. And once you learn to read forex charts across different formats, you’ll start seeing the market from angles most retail traders never bother to explore.
Here’s the complete lineup — no fluff, just the meat and potatoes.
Line Chart – Clean and Simple
The line chart is the little black dress of forex charts. It connects closing prices from one period to the next with a single smooth line. That’s it. No wicks. No noise. Just pure direction. How to read a forex trading chart in its simplest form? Start with a line chart. Best for seeing the forest, not the trees. If you want to know whether EUR/USD has been climbing or falling for the last six months, a line chart tells you in two seconds. Downside? You lose all the juicy details — how hard buyers fought, where price rejected, how wide the range was.
Bar Chart (OHLC) – Shows Open, High, Low, Close
Before candlesticks took over the world, there were bar charts. Each vertical bar represents one period. A little notch on the left is the open. A notch on the right is the close. The top of the bar is the high. The bottom is the low. Best for traders who like raw data without the pretty colors. Some old-school pros swear by them. Downside? Less intuitive than candlesticks. Your brain has to work harder to see who won the fight.
Candlestick Chart – The Gold Standard
This is the heavyweight champion. Candlesticks were invented by Japanese rice traders in the 18th century, and guess what? They still crush it today. Each candle has a body (open to close) and wicks (high to low). Green body? Bulls won. Red body? Bears won. If you only learn to read forex charts on one format, make it this one. Best for everyone. Seriously. Start here. Stay here. Downside? None. It’s the industry standard for a reason.
Renko Chart – Filters Out the Noise
Renko bricks ignore time completely. A new brick only appears when price moves a certain number of pips. Up brick = bullish. Down brick = bearish. No wicks, no time, no clutter. Forex trading charts explained through Renko feels like cleaning fog off a windshield. Best for trend traders who hate chop. If you can’t stand sideways markets, Renko is your best friend. Downside? You lose all sense of time. A brick could take five minutes or five hours to form.
Point & Figure (P&F) – No Time, Just Price
Point & Figure charts are the granddaddy of noise filtering. They use X’s for rising price and O’s for falling price. Time doesn’t exist. Only pure price movement matters. A new column starts when price reverses by a certain amount. How to read a forex trading chart that ignores time? It’s weird at first, then it clicks. Best for identifying support, resistance, and breakouts without getting whipsawed. Downside? Unusual to look at if you grew up on candlesticks. Takes a minute to wrap your head around it.
Kagi Chart – Reversal-Based Moves
Kagi charts look like a thick, winding line. When price reverses by a certain amount, the line changes direction and thickness. Thick line = bullish. Thin line = bearish. Time? Completely ignored. Best for seeing trend strength at a glance. The line gets thicker when bulls are in control. Downside? Laggy on fast reversals. Not for scalpers.
Heikin-Ashi – Smooth Candlesticks
Heikin-Ashi means “average bar” in Japanese. It takes standard candlestick data and averages it to create smoother candles. The result? Fewer fake reversals, cleaner trends. If you’re trying to learn to read forex charts without getting whipsawed by every tiny pullback, Heikin-Ashi is a cheat code. Best for trend followers who hate noise. Downside? Laggy by nature. You’ll enter later and exit later.
Range Bar Chart – Constant Price Movement
Range bars are simple. Each bar moves a fixed number of pips, say, 10 pips, before a new bar forms. Time doesn’t matter. Five seconds or five hours? Who cares. The bar finishes when price travels far enough. Forex trading charts explained through range bars equalize volatility. Best for traders who want consistent bar size regardless of time. Downside? You lose time context completely.
Tick Chart – Transaction-Based
Tick charts ignore time and price movement. Instead, each bar forms after a fixed number of transactions. 500 ticks? New bar. 1000 ticks? New bar. This is how professional scalpers roll. Best for high-volume trading sessions like London or New York open. Downside? Useless during slow hours. You’ll stare at a flat line for twenty minutes.
Volume Chart – Each Bar = Fixed Volume
Volume charts build a new bar after a fixed amount of trading volume changes hands. 10,000 contracts? New bar. Doesn’t matter if it took five minutes or five hours. How to read a forex trading chart based on volume? It shows you where the real action is. Best for traders who want to know when the crowd is actually participating. Downside? Forex volume is approximate at best (no central exchange).
Comparative Table
| Chart Type | Time Included | Noise Level | Best For | Beginner Friendly |
|---|---|---|---|---|
| Line | Yes | Very low | Trend at a glance | High |
| Bar (OHLC) | Yes | Medium | Raw data lovers | Medium |
| Candlestick | Yes | Medium | Everything | High |
| Renko | No | Very low | Clean trends | Medium |
| Point & Figure | No | Very low | Support/resistance | Low |
| Kagi | No | Low | Trend strength | Low |
| Heikin-Ashi | Yes | Low | Smooth trends | Medium |
| Range Bar | No | Medium | Consistent bar size | Medium |
| Tick | No | High | Scalping | Low |
| Volume | No | Medium | Volume-based entries | Low |
Step by Step – How to Read Forex Charts Like a Pro
To learn how to read forex charts correctly, you don’t need a $3,000 course. You don’t need to quit your job and stare at screens for fourteen hours a day. You need four simple steps and five minutes of honest screen time. Let me walk you through it.
Step 1: Check the timeframe
This is where most newbies screw up. They stare at a 1-minute chart like a deer in headlights and wonder why they’re losing their shirt. Here’s the rule: Daily chart for direction. 4-hour chart for entry. The daily tells you which way the wind is blowing. The 4H tells you when to set sail. How to read forex charts for beginners starts with understanding that not all timeframes are created equal.
Step 2: Find the trend
Look from left to right. Are you seeing higher highs and higher lows? That’s an uptrend. Lower highs and lower lows? Downtrend. Neither? Stay on your hands and do nothing. Forex trading charts for beginners should look like a staircase — either going up, going down, or flat. Don’t trade flat. It’s a trap.
Step 3: Spot support and resistance
Support is a floor where price keeps bouncing up. Resistance is a ceiling where price keeps hitting its head and falling. Mark them with horizontal lines. How to read charts in forex trading without support and resistance is like driving without road lines. You can do it, but you’ll probably crash.
Step 4: Read the last candle
The rightmost candle tells you who won the last fight. Green body? Bulls walked away with the trophy. Red body? Bears did. A long wick on top? Sellers rejected the move. A long wick on bottom? Buyers stepped in. How to read charts for forex trading boils down to asking one question every single time: who’s in control right now?
That’s it. No voodoo. No 27 indicators. How to read forex chart properly means ignoring 90% of the junk you see on YouTube and just watching price, trend, and levels. Do these four steps every morning for 30 days, and you’ll read charts faster than most “professional” traders on Instagram.
Understanding Forex Trading Charts – The Key Elements
When you learn how to read forex charts, you need to know the bones of every chart. Not the fancy stuff. Not the glitter. The bones. Here are the four that matter.
- Pip. The smallest price move. In most pairs, it’s 0.0001. Think of it as the heartbeat of the market. One pip up. One pip down. That’s life.
- Spread. The broker’s cut. It’s the difference between the buy price and the sell price. Tight spread = good for you. Wide spread = you’re getting robbed slowly.
- Trend. The path of least resistance. Price wants to keep doing what it’s been doing. Your job is to get on board, not fight the current.
- Volume. How many traders are jumping in. More volume means more conviction. Low volume? That’s a ghost town. Stay out.
Understanding forex trading charts isn’t about memorizing fifty indicators. It’s about reading these four elements like a conversation. Price is talking. Spread is whispering. Trend is shouting. Volume is nodding or shaking its head.
Once you get this, understanding forex charts becomes second nature. You stop guessing. You start seeing. And forex trading reading charts turns from a chore into something you actually look forward to every morning with your coffee.
Forex Charts for Beginners – Mistakes to Avoid
I’ve seen more newbies blow up their accounts than I can count. Smart people. Hard workers. Nice humans. But they all made the same mistakes when they tried to learn how to read forex charts.
Here’s what kills most of them.
Mistake #1: Staring at 1-minute charts all day
The 1-minute chart is a casino. It’s noise wrapped in chaos dipped in anxiety. You want to lose your mind and your money? Live on the M1. You want to actually learn? Zoom out.
Mistake #2: Ignoring the higher timeframes
The daily chart is your boss. The 4H is your manager. The 1-minute chart is some intern nobody listens to. Check the higher timeframes first. Always.
Mistake #3: Watching ten currency pairs at once
You can’t focus on ten screaming children at once. Same with forex. Pick one pair. Learn its personality. EUR/USD moves different than GBP/JPY. Respect that.
Mistake #4: Adding indicators before understanding price
Indicators are not shortcuts. They’re lagging band-aids. Forex charts for beginners should be naked. Raw price. No MACD. No RSI. No Stochastics. Just candles, trend, and levels.
Read forex charts beginners often overlook the simplest truth: less is more. One pair. One timeframe. One direction. That’s how you survive the first six months.
Forex trading charts for beginners don’t need to be complicated. They need to be understood. Stick to one pair, one timeframe, and raw price. That’s how you win. Not by knowing more. By doing less, but doing it right.
Conclusion
Learning how to read forex charts takes practice, not perfection. You don’t need to be a genius. You need to be consistent. Start with one chart type (candlestick), one timeframe (daily), and one currency pair (EUR/USD). That’s it. Do the reps for 30 days — ten minutes every single morning — and you’ll be ahead of 90% of casual traders who chase shiny objects instead of building real skills.
FAQ
What’s the fastest way to learn how to read forex trading charts?
Look at a daily chart for 10 minutes every day. No indicators. No noise. Just watch price move left to right. Do that for a month, and something will click.
Do I need to learn all 10 chart types?
No. Stick with candlesticks for your first 3 months. The rest are seasoning, not the main dish. Master the basics before you get fancy.
Can I learn to read forex charts without risking real money?
Yes. Open a free demo account tomorrow morning. Fake money, real skills. Practice until reading charts feels like reading a menu.
What’s the #1 beginner mistake?
Zooming in too close. Newbies stare at 1-minute or 5-minute charts like they’re reading tea leaves. Pull back to the daily chart first, then drill down. Big picture first. Always.

