Moving Averages
I have looked at thousands of charts. Bitcoin, Tesla, gold, EUR/USD, you name it. And those squiggly lines you see everywhere, the ones weaving through price action like vines on a fence, those are moving averages. Most traders stare at them and have no clue what they actually mean. I used to be the same way. But here is the truth. Moving averages are just a tool to cut through the noise. They filter out the daily panic and FOMO and show you what the market is really doing. Whether you trade crypto, stocks, forex, or oil, the logic is exactly the same.
Moving averages will not make you rich overnight. They do not predict the future. But they will keep you on the right side of the trade more often than not. In this guide, I will show you exactly how to read them, which ones matter, and how to use them for entry and exit signals. No math vomit. No theory for the sake of theory. Just what works.
What Are Moving Averages? Definition and Basics
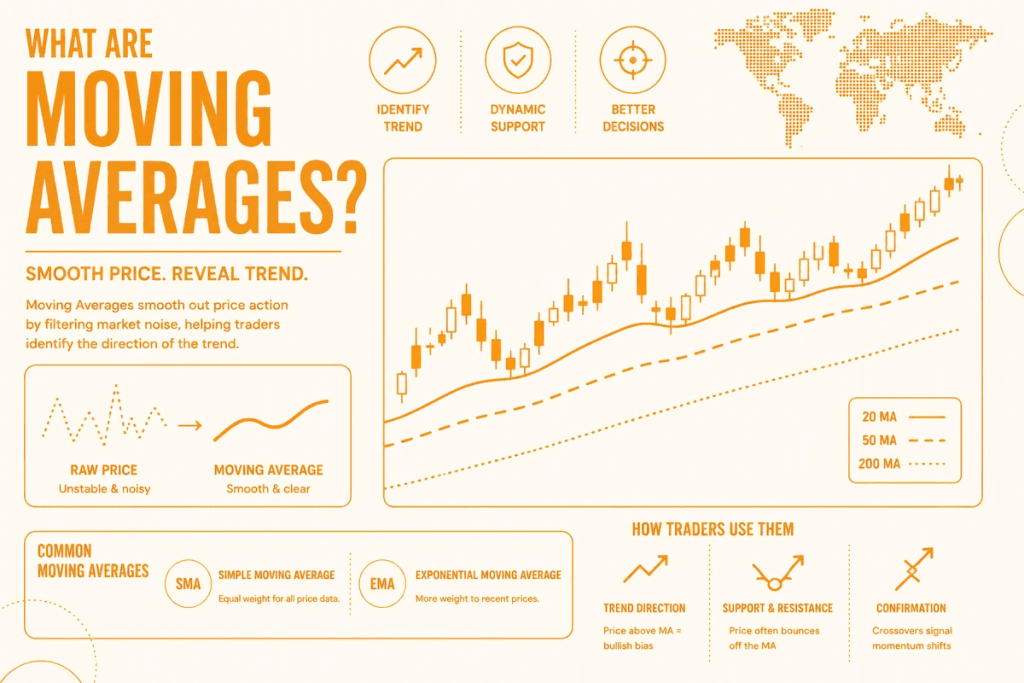
Let me start with a simple definition. A moving average is just the average price of an asset over a certain number of past candles. That is it. Nothing magical. If you look at a 20 day moving average on Bitcoin, it takes the closing price of the last 20 days, adds them up, divides by 20, and draws a line. Then every day, it drops the oldest day and adds the newest one. The line moves. Hence the name.
Why does this matter? Because price is noisy. One minute Bitcoin is up 2%. The next minute it dumps. A moving average smooths all that out. It shows you the bigger picture instead of every single hiccup.
Here is what most people get wrong. Moving averages are what we call lagging moving averages. They only look backward. They do not predict where price is going. By the time a moving average turns up, price has already moved. Some traders hate this. They call them useless because they are “slow.” But I see it differently. Lag is not a bug. It is a feature. It keeps you from jumping on every fakeout and head fake. So the short answer to the question “are moving averages lagging indicators?” is yes. Absolutely. And that is okay.
So do moving averages work? Yes and no. They work if you understand what they are for. They are not crystal balls. They are trend filters. When price is above a key moving average and the average is sloping up, I only look for buys. When price is below and sloping down, I only look for sells. That simple rule alone will save you from so many bad trades.
The traders who fail with moving averages are the ones who treat them like magic lines that must hold. “Price bounced off the 50 day exactly!” Yeah, sometimes it does. Sometimes it blows right through it. The moving average did not cause the bounce. It just showed you where other traders were watching.
Bottom line. Moving averages are not predictive. They are reactive. But in trading, being reactive to what price is actually doing beats being predictive and wrong. Learn to respect the lag instead of fighting it.
Types of Moving Averages: EMA, SMA, WMA, VWMA and More
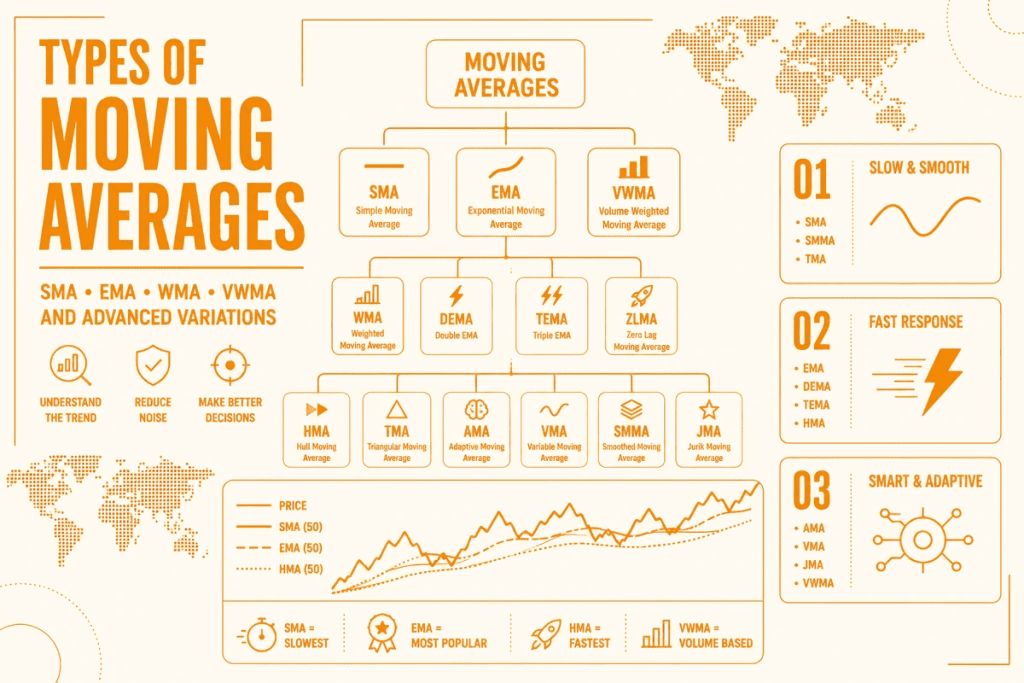
Not all moving averages are built the same. Some are slow and smooth. Others are fast and snappy. Some are exotic and rarely used. The ones you choose will change how you see the market. Let me walk you through the most common types and a few advanced ones.
Simple Moving Average (SMA)
The simple moving average (SMA) is the most basic one. It takes the last X number of closing prices, adds them up, and divides by X. Equal weight to every single candle. A 20 day SMA gives the same importance to day 1 as day 20. This makes it slow and smooth. The SMA does not react quickly to new price action. That can be good if you want to filter out noise. It can be bad if you want to catch moves early. Most long term traders love the SMA. Day traders often find it too sluggish.
Exponential Moving Average (EMA)
The exponential moving average (EMA) fixes the SMA’s biggest problem. It gives more weight to recent prices. That means it reacts faster. When price makes a sharp move, the EMA turns much quicker than the SMA. This makes exponential moving averages (EMA) the go to choice for short term traders and swing traders. But speed comes with a price. The EMA is more prone to fakeouts. It whipsaws more. You have to decide what you value more: speed or reliability.
Weighted Moving Average (WMA)
The weighted moving average takes the idea of the EMA and cranks it up. Instead of using a formula that fades weight exponentially, you can assign any weights you want. More weight to recent prices. Less weight to older prices. The math is different from the EMA, but the goal is the same: react faster. In practice, most traders stick with the EMA because it is simpler and does the job. The weighted moving average is less common but worth knowing.
Exponentially Weighted Moving Average
The exponentially weighted moving average is just a fancy name for the EMA. Some platforms call it this to be more precise about the math. The word “exponentially” refers to how the weights decrease. Each older price gets multiplied by a factor that gets exponentially smaller. Do not let the name scare you. It is the exact same thing as the EMA. So if you see exponentially weighted moving averages on a platform, you already know how to use them.
Volume Weighted Moving Average (VWMA)
The volume weighted moving average (VWMA) adds one more ingredient: volume. A normal moving average treats every candle the same. The VWMA does not. Candles with higher volume get more influence on the average. Candles with low volume get less. This is useful because high volume candles often matter more. They show where big money is active. The volume weighted moving average (VWMA) works especially well for stocks and crypto where volume varies a lot from one candle to the next.
Hull Moving Average (HMA)
The hull moving average is a faster and smoother alternative. It was designed to kill lag completely. The math is more complex, but the result is simple. The HMA moves quickly when price changes direction but stays smooth without whipsaws. Many traders love the hull moving average for trend following. It works well on higher timeframes. On lower timeframes, it can still be noisy.
Triangular Moving Average (TRIX or TMA)
The triangular moving average is a double smoothed SMA. You take an SMA, then take another SMA of that SMA. The result is a curve that is extra smooth. The name comes from the shape of the weight distribution. It looks like a triangle. The triangular moving averages are useful when you want to ignore almost all short term noise. They are slow, but reliable.
Variable Moving Average (VMA)
The variable moving average adjusts its smoothness automatically based on market volatility. When the market is choppy, it gets slower. When the market is trending hard, it speeds up. The variable moving average tries to solve the problem of picking one fixed period. It never really caught on with retail traders, but some institutional algorithms use it.
Adaptive Moving Average (AMA or KAMA)
The adaptive moving average is similar to the VMA but uses a different formula. It was developed by Perry Kaufman. The adaptive moving averages change their sensitivity based on market noise and trend strength. When price is moving cleanly, the AMA hugs price tightly. When price is going sideways, it flattens out. This is one of the more advanced adaptive moving averages and requires some study to use well.
Smoothed Moving Average (SMMA or RMA)
The smoothed moving average is like an EMA with a longer memory. It gives weight to all past data, not just recent candles. The weights never fully drop to zero. This makes the smoothed moving average extremely smooth. It is often used as a signal line inside other indicators, like the RSI. On its own, it is too slow for most traders.
Double Exponential Moving Average (DEMA)
The double exponential moving average (DEMA) tries to cut lag even more than a normal EMA. It uses two EMAs and some extra math to get a faster response. The double exponential moving average (DEMA) reacts to price changes almost instantly. But it is also more sensitive to fakeouts. Use it carefully.
Triple Exponential Moving Average (TEMA)
The triple exponential moving average (TEMA) takes the same idea one step further. Three EMAs blended together for even less lag. The triple exponential moving average (TEMA) is one of the fastest moving averages you can use. It is almost like drawing a line through the wicks. Great for very short term trading. Useless for long term trends.
Jurik Moving Average (JMA)
The jurik moving averages are proprietary. They were designed to be smooth and have almost zero lag at the same time. The math is complex and not open source. Many professional traders swear by jurik moving averages. They are available on some platforms but not all. If you have access to them, test them. They are impressive.
Zero Lag Moving Average (ZLMA)
The zero lag moving averages try to remove lag by subtracting an EMA from another EMA. The idea is to see where price would be without the delay. The zero lag moving averages can look like they predict the future, but they do not. They just smooth differently. They repaint slightly and can give false confidence to beginners.
How to Read Moving Averages in Stocks and Crypto
Reading moving averages is not hard. Most beginners overcomplicate it. You do not need to be a genius. You just need to know what to look for. Let me show you.
Start With Price Position
The first thing I look at is where price sits relative to the moving average. When price is above the moving average, buyers are in control. When price is below, sellers are in control. That is it. Do not overthink it. If you are looking at how to read moving averages in stocks or crypto, start right here. Above is bullish. Below is bearish.
The Slope Tells You The Story
The moving average slope direction is everything. A moving average that is flat tells you the market has no trend. Stay out. A moving average that is pointing up tells you to look for buys only. A moving average that is pointing down tells you to look for sells only. The steeper the slope, the stronger the trend. I have learned over the years that moving average slope direction is more important than the actual price crossing above or below.
Different Timeframes Give Different Views
Here is something that confuses a lot of new traders. Why moving averages are different time frames matters more than you think. A 20 period moving average on a 5 minute chart is not the same as a 20 period on a daily chart. The first shows you 100 minutes of price action. The second shows you 20 days. Neither is right or wrong. They just answer different questions. Shorter timeframes give you faster signals. Longer timeframes give you the bigger picture. You need both.
How To Filter Out The Noise
Markets are messy. Most of what you see on a chart is just noise. Random moves. Stop hunts. News spikes that reverse five minutes later. Moving averages for filtering market noise are perfect for this job. A moving average smooths out the chaos. It helps you see the real direction instead of getting whipsawed by every little move. When I feel like the market is faking me out, I zoom out to a higher timeframe moving average. It almost always calms down the noise.
Stack Multiple Moving Averages
Reading one moving average is fine. Reading two or three is better. Put a fast moving average and a slow one on the same chart. When the fast one is above the slow one and both are sloping up, you are in a strong uptrend. When the fast is below the slow and both slope down, strong downtrend. When they cross back and forth, stay away. This is how experienced traders use how to read moving averages in stocks without getting chopped up.
The Moving Average As A Magnet
Price loves to return to the moving average. It is like a rubber band. If price gets too far above, it will often pull back to the moving average. If it gets too far below, it will bounce up to it. Knowing this helps you wait for better entries instead of chasing. When I see price too extended from the moving average, I do not buy. I wait for the pullback. The moving average almost always gets tested again.
How to Trade Moving Averages: Practical Strategies
Knowing what moving averages are is one thing. Knowing how to trade them is another. Let me show you the exact ways I use moving averages to enter trades, exit trades, and stay on the right side of the market.
Trend Identification First
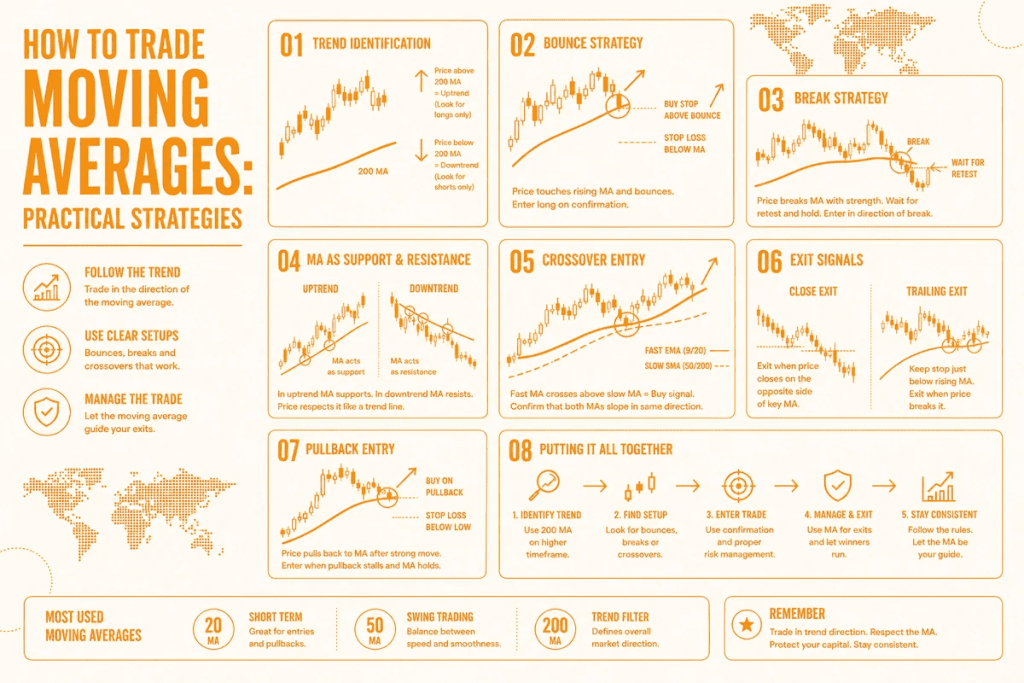
Before I take any trade, I need to know the trend. The moving average for trend identification is the simplest tool for this job. I put a 200 period moving average on the daily chart. If price is above it and the moving average is pointing up, I am only looking for long trades. If price is below it and pointing down, I only look for short trades. That is it. I do not fight the moving average. I have learned that moving average for trend identification keeps me out of so many losing trades.
The Bounce Strategy
The most common way I use moving averages for entry and exit signals is the bounce. Price comes down to a rising moving average, touches it, and bounces back up. That is my entry. I place a buy stop just above the bounce candle. My stop loss goes below the moving average. This works because so many other traders watch the same moving averages. The 20, 50, and 200 period moving averages are the most popular. When price respects them, it often continues the trend.
The Break Strategy
Sometimes price does not bounce. It blows right through the moving average like it is not even there. That is also a signal. When price breaks through a moving average with a strong candle, especially on high volume, the trend might be changing. I wait for the break, then I wait for a retest. If price comes back to the moving average and holds on the other side, I enter. This is another way to use moving averages for entry and exit signals without getting faked out.
Moving Average As Support And Resistance
Here is something that took me years to fully trust. The moving average as support and resistance is real. In an uptrend, the moving average acts like a floor. Price keeps bouncing off it. In a downtrend, it acts like a ceiling. Price keeps getting rejected from it. I mark the moving average like I would mark a horizontal support or resistance line. When price holds above a rising moving average, I stay long. When it cannot break above a falling moving average, I stay short. The moving average as support and resistance works because institutions watch the same numbers you do.
The Crossover Entry
Two moving averages are better than one. I use a fast EMA, like the 9 or 20, and a slow SMA, like the 50 or 200. When the fast crosses above the slow, that is a potential buy signal. When it crosses below, a sell signal. But I never take these crosses blindly. I look for the moving average slope direction to confirm. If the fast crosses above but the slow is still flat or falling, I pass. The crossover only matters when both moving averages are pointing the same way.
Exit Signals
Exits are harder than entries. Most traders focus on getting in. I focus on getting out. I use moving averages for exit signals in two ways. First, I exit when price closes on the opposite side of a key moving average. If I am long and price closes below the 50 day, I am out. Second, I trail a moving average. I keep my stop loss just below the rising moving average and let it lift higher each day. When price finally breaks it, I am already out. That is a clean, mechanical way to use moving averages for entry and exit signals for both.
The Pullback Entry
Not every trade is a bounce off the moving average. Sometimes the best trades are pullbacks into the moving average after a strong move. Price runs hard, pulls back to the moving average, and then continues. I enter when I see the pullback stall and the moving average hold. My stop goes below the pullback low. This works better than chasing price when it is already extended. It takes patience, but it is worth it.
Putting It All Together
This is how to trade moving averages in real life. Start with the 200 day to identify the trend. Use the 20 or 50 for entries and exits. Watch for bounces, breaks, and crossovers. Treat the moving average like a support or resistance line. And never fight the slope. If you do these things consistently, you will be better than most traders who just slap a moving average on their chart and hope for the best.
Which Moving Averages Are Most Important? Settings and Periods
Not all moving averages matter the same. Some periods are watched by millions of traders and institutions. Others are just noise. Let me tell you which ones actually move the market.
- 20 period moving average. The short term trend line. Used by active day traders and swing traders. Price bouncing off the 20 is a fast entry signal.
- 50 period moving average. The intermediate trend. This is a big one. Institutions watch the 50 heavily. When price crosses the 50 on high volume, people pay attention.
- 200 period moving average. The king. The long term bull or bear line. Above the 200, we are in a bull market. Below it, a bear market. Many funds will not take a long trade unless price is above the 200.
- 100 period moving average. Less famous but still important. Often used as a middle ground between the 50 and 200.
- 21, 34, 55 period. Fibonacci numbers. Some traders swear by these instead of the round numbers. The 21 and 55 are especially common.
So which moving averages are most important? The 20, 50, and 200. Master those three before you touch anything else.
Now here is a pro metric. The percentage of stocks above moving averages tells you how healthy the entire market is. When more than 70% of stocks in the S&P 500 are above their 50 day moving average, the market is strong. When less than 30% are above, it is weak. I check this number every single day. It keeps me from fighting the broader market.
CONCLUSION
Moving averages are not a perfect system, but when understood and applied correctly, they provide a strong foundation for any trading strategy. Choosing the right type, setting appropriate periods, and combining signals with price action and volume increases their effectiveness significantly.
I have been using moving averages for years. They have saved me from more bad trades than I can count. They are not magic. They will not make you a millionaire overnight. But they will keep you organized. They will keep you on the right side of the trend. And that alone puts you ahead of most traders who click buttons based on gut feelings.
Start simple. Use the 20, 50, and 200. Watch the slope. Respect the lag. And never forget that price always has the final say. Moving averages just help you read what price is already telling you.
FAQ
1. Are moving averages lagging indicators?
Yes. Moving averages are lagging indicators by definition. They are calculated from past prices. They cannot predict the future. This is not a flaw. The lag keeps you from jumping on every fake breakout. Learn to accept it and you will trade better.
2. Do moving averages work in all market conditions?
No. Moving averages work best in trending markets. They struggle in choppy, sideways markets. When price is just bouncing back and forth, moving averages will give you constant false signals. In those conditions, it is better to step aside or use a different tool.
3. Why are moving averages different on different time frames?
Because each time frame uses different data. A 20 day moving average on a daily chart looks at 20 daily closes. A 20 period moving average on a 5 minute chart looks at 20 five minute closes. They answer different questions. The daily shows you the long term trend. The 5 minute shows you the short term. Neither is wrong. You just need to know which one you are looking at.
4. Which moving averages are most important for day trading?
For day trading, the 9, 20, and 50 period exponential moving averages on a 5 minute or 15 minute chart are the most popular. The 200 period on a 1 hour chart is also useful as a trend filter. But if you are new, start with the 20 and 50 EMA. Those two will cover most day trading setups.
5. How to read moving averages in stocks for beginners?
Start with one moving average. The 200 day simple moving average is the best place to begin. If price is above it and the line is sloping up, the stock is in a long term uptrend. Only look to buy. If price is below it and sloping down, only look to sell or stay out. That is the most important lesson I can give a beginner.
6. How to trade moving averages without getting false signals?
Use multiple moving averages together. Do not trade every crossover. Wait for the slope to confirm. And always use a filter like volume or RSI. For example, only take a buy signal when the fast moving average crosses above the slow moving average AND volume is above average AND the slow moving average is already sloping up. That will cut out most of the noise.
7. What is the best moving average for entry and exit signals?
There is no single best. But the combination of a fast EMA (9 or 20) and a slow SMA (50 or 200) is the most common. For entries, take crossovers or bounces. For exits, use the opposite side of the same moving average. Trail the slow moving average for exits in strong trends. That keeps you in the trade longer.
8. What does percentage of stocks above moving averages tell you?
It tells you how healthy the overall market is. When more than 70% of stocks in an index are above their 50 day moving average, the market is strong and broad. When less than 30% are above, the market is weak. This is a great filter. I do not take long trades when the percentage is below 30. I do not take short trades when it is above 70.
9. Can moving averages act as support and resistance?
Yes, absolutely. In an uptrend, a rising moving average acts as dynamic support. Price bounces off it and continues higher. In a downtrend, a falling moving average acts as dynamic resistance. Price rejects it and continues lower. This works because so many traders watch the same moving averages and place orders there. It becomes a self fulfilling prophecy.
10. How to use moving average slope direction in trading?
Use the slope as your trend filter. Only take long trades when the moving average is sloping up. Only take short trades when it is sloping down. If the slope is flat, do nothing. The steeper the slope, the stronger the trend. This one rule will keep you from trading against the market. It is simple, but it works.

