What Is Doji in Trading?
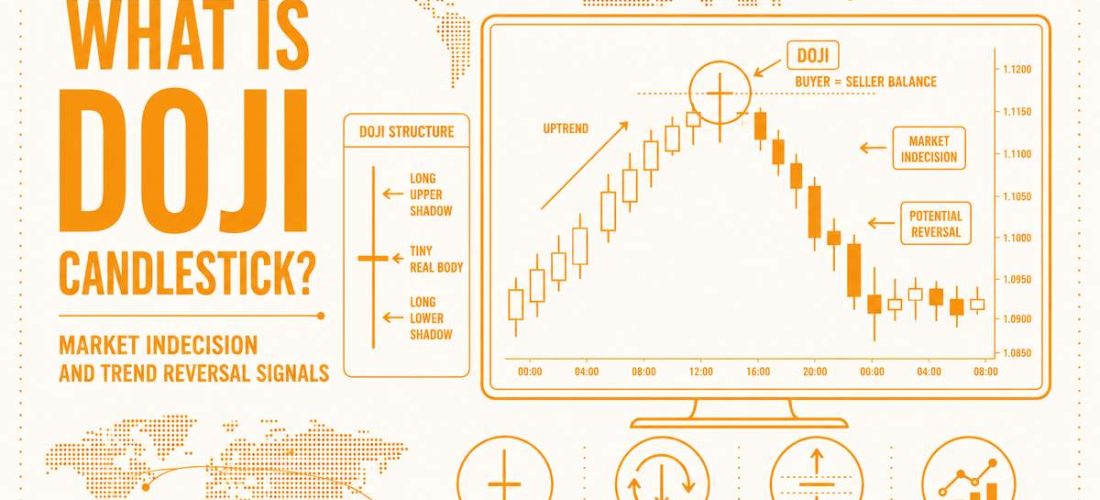
Ever glanced at a stock or crypto chart and spotted a tiny little candle that looks like a cross, a plus sign, or someone just shrugged? That’s not a glitch. That’s a Doji. And in the trading world, it is one of the loudest signals of pure, gut wrenching indecision you will ever see. So, what is a Doji candlestick? Picture a boxing match where both fighters land a punch at the exact same second and both hit the canvas together. Nobody won. That is your Doji. The open price and close price are nearly identical after a whole trading session.
But here is where things get interesting. For new traders, a Doji might look like nothing happened. Just a boring candle with no real movement. In reality, it is the market catching its breath, holding a finger up, and saying, “Hold my beer, I cannot decide which way to go.” Understanding the real doji meaning in trading separates rookies who get faked out from traders who smell a turning point before it happens. Think of it as a yellow traffic light, not a red one. It will not tell you to stop or go. But it will warn you that the wind is about to shift.
What is a Doji Candlestick? (Basic Definition)
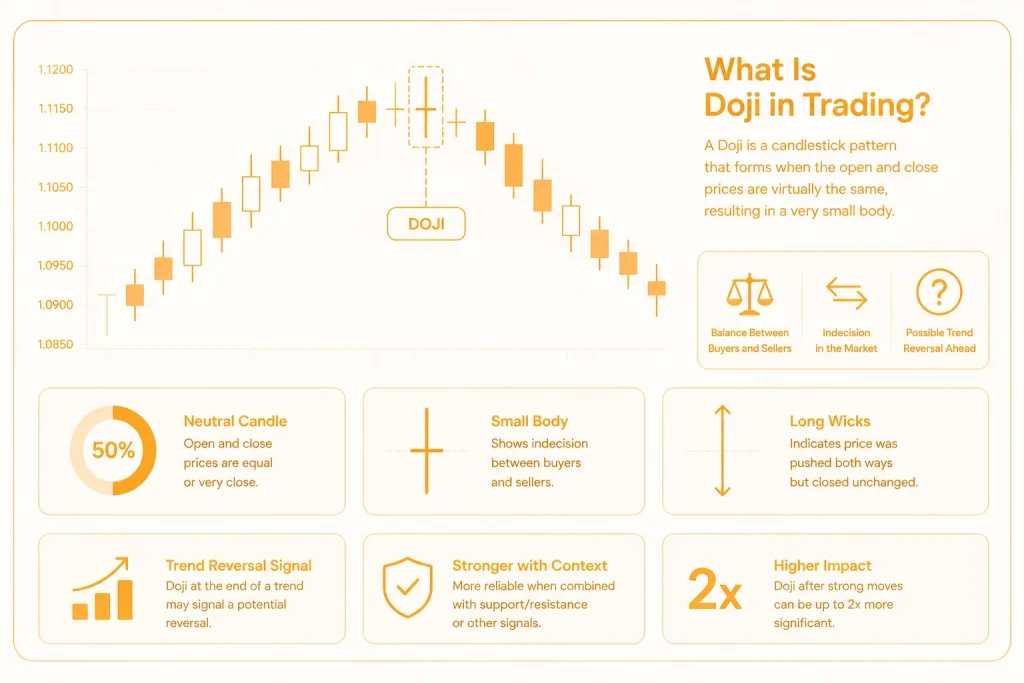
Let’s strip away all the fancy jargon and get down to brass tacks. A Doji candlestick forms when a security’s open price and close price are virtually the same. That’s it. Not almost the same. Not close enough for government work. Virtually identical. When buyers and sellers fight tooth and nail all session long and end up exactly where they started, you get a Doji candle.
Think of it like a tug of war where both teams are equally matched. They pull left. They pull right. They grunt and sweat for hours. But when the final whistle blows, the red flag in the middle hasn’t moved an inch. That stalemate is the Doji pattern in pure visual form. The candle body shrinks down to a tiny horizontal line or a very thin sliver. The wicks can be short or long, but the body tells the real story: zero progress. No one flinched. No one blinked. And that quiet standoff is exactly what makes this pattern so powerful for traders who know how to read it.
Doji Meaning: The Indecision Candle
Here is the cold hard truth. The market hates a tie. Traders open their platforms every morning expecting one thing: a winner. They want prices to rip higher or crash lower. But every once in a while, the universe delivers a big fat draw. That draw has a name. It is called a Doji indecision candle. And the doji meaning is simpler than most people realize. It means buyers had their shot. Sellers had their shot. And after all the punching and dodging, the scoreboard reads zero to zero.
So what is the real meaning of doji? It is psychological gridlock. Fear and greed cancel each other out like matter and antimatter. The bulls step in and push prices up. Then the bears step in and shove prices right back down. This tug of war happens over and over within the same trading session. By the closing bell, neither side has bragging rights. That is the core of it. Not victory. Not defeat. Just a sweaty, exhausted handshake in the middle of the ring.
Now ask yourself this. What does doji candle indicate about the future? Indecision is like a coiled spring. When a market cannot decide which way to go, the pressure builds. Eventually, that spring snaps. A breakout happens. A breakdown happens. Something has to give. That is why experienced traders sit up straight when they spot a Doji. It does not tell you exactly where price will go next. But it screams one thing loud and clear: the quiet moment before the storm has arrived. Sometimes the trend continues. Sometimes it reverses. Either way, the calm never lasts forever.
Is Doji Bullish or Bearish? (The Key Question)
New traders ask this question all the time. Is a doji bullish or bearish? The answer might sting a little. By itself, a Doji is neither. Zero. Zilch. Nada. It is a neutral pattern born from pure indecision. That means anyone telling you “a Doji means price will go up” or “a Doji means price will crash” is selling you a bridge in Brooklyn. The truth is more nuanced. And nuance makes money.
So the real question is not is doji bullish or bearish in isolation. The real question is: bullish or bearish relative to what came before? Context is the king, queen, and entire royal family of technical analysis. A Doji after a massive green rally whispers something very different than a Doji after a brutal red freefall. To ask are doji bullish or bearish without looking at the trend is like asking if an umbrella is useful without checking if it is raining. It depends completely on where you stand.
Here is a simple breakdown of how context flips the script. When a Doji forms after a long uptrend, it suggests buyers are running out of gas. The party might be ending. That is a bearish warning. When a Doji forms after a long downtrend, it suggests sellers are exhausted. The hammer might be dropping from their hands. That is a bullish warning. And when a Doji appears in the middle of a sideways market? It means nothing. Just more noise. Chop city. Move along.
Bullish vs Bearish
Doji Contexts
Is Doji a Reversal Pattern?
Here is where a lot of traders get burned. They see a Doji and immediately yell “Reversal!” like they just spotted smoke and fire at the same time. But slow your roll. A doji reversal pattern is a real thing. Yes. It exists. But here is the kicker. It signals a potential reversal, not a guaranteed one. There is a massive difference between “maybe the trend will change” and “the trend is changing right now.” Confusing those two will empty your trading account faster than a Vegas slot machine.
So is doji a reversal pattern in the strict sense? Technically, yes. The Doji is classified as a reversal pattern in classic candlestick theory. But that classification comes with a giant asterisk. You can slap the label “reversal” on anything you want. That does not mean the market cares. A Doji only becomes a true reversal pattern when it appears after a clear, sustained trend and when the next candle confirms the move. Without confirmation, it is just a question mark shaped like a candle.
The bigger question might be is doji a reversal candle every single time? Absolutely not. And this is the part most beginners miss. Dojis can actually play two different roles depending on where they show up. A reversal Doji happens at the top of an uptrend or the bottom of a downtrend. It signals the old trend is running out of gas and might flip. But a continuation Doji is a different animal entirely. That one appears in the middle of a strong trend, acts like a brief rest stop, and then price keeps plowing in the same direction. Same candle shape. Completely opposite meaning.
Think of it this way. A Doji is like a driver pulling over to check a map. Sometimes they pull over, realize they missed their exit, and turn around. That is a reversal. Other times they pull over, take a sip of coffee, and get right back on the same highway. That is continuation. The Doji alone does not tell you which one will happen. You need to look at the bigger picture. What came before? Where is the support or resistance? What does the next candle do? Answer those questions first, then call it a reversal.
Types of Doji Candlesticks (Complete List)
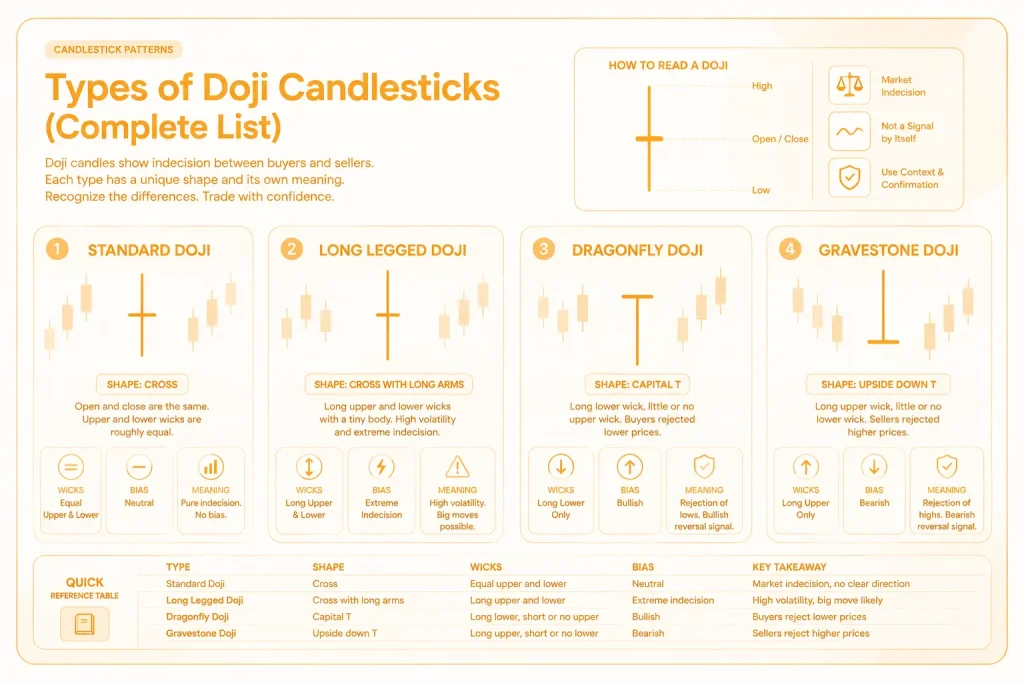
Not all Dojis are created equal. That is a fact too many traders learn the hard way. Some look like crosses. Some look like capital T’s. Others look like upside down golf tees. Each shape tells a slightly different story. Understanding the types of doji is like learning to read different facial expressions. A smirk is not the same as a frown, even though both happen on a face. The same logic applies here. Let us break down the types of doji candles so you know exactly what the market is whispering.
Most experts agree there are four main types of doji candlesticks you will see on a regular chart. But some traders split them into three categories by grouping the standard and long legged together. Either way, knowing the types of doji and meaning behind each one gives you a serious edge. You will stop guessing and start recognizing patterns with confidence.
1. Standard Doji
This is the classic vanilla version. The open price and close price are almost exactly the same. The upper and lower wicks are roughly equal in length. A standard Doji looks like a perfect cross or a plus sign. It tells you the market fought hard in both directions and ended right back where it started. Pure indecision. No bias. No favoritism. Just a clean, honest draw.
2. Long Legged Doji
Now we are turning up the volume. A long legged Doji has long upper and lower wicks with a tiny body in the middle. Think of it as a standard Doji on steroids. This shape screams high volatility and extreme indecision. Prices shot up. Prices crashed down. Then prices came right back to the middle. Markets form this pattern during major news events, Federal Reserve announcements, or earnings reports. It says traders are scared, confused, and pulling in opposite directions with maximum effort.
3. Dragonfly Doji
Here is where things get bullish. A Dragonfly Doji forms when the open, high, and close are all near the top of the candle. The lower wick is long. The upper wick is very short or completely missing. This shape looks like a capital T or a dragonfly sitting on a pond. What does it mean? Sellers pushed prices way down during the session. But buyers stormed back and drove prices all the way up to the open by the close. That is rejection of lower prices. In a downtrend, the Dragonfly Doji is a powerful bullish reversal signal. Buyers said “no more” and meant it.
4. Gravestone Doji
Flip the Dragonfly upside down and you get the Gravestone Doji. This one forms when the open, low, and close are all near the bottom of the candle. The upper wick is long. The lower wick is very short or missing. It looks like an upside down capital T or a literal gravestone sticking out of the ground. The story here is simple. Buyers pushed prices way up during the session. But sellers crushed them back down to the open by the close. That is rejection of higher prices. In an uptrend, the Gravestone Doji is a serious bearish reversal signal. Sellers said “enough is enough” and slammed the door.
Quick Reference: The 4 Types of Doji Candles
| Type | Shape | Wicks | Bias |
|---|---|---|---|
| Standard Doji | Cross | Equal upper and lower | Neutral |
| Long Legged Doji | Cross with long arms | Long upper and lower | High volatility, extreme indecision |
| Dragonfly Doji | Capital T | Long lower, short or no upper | Bullish (rejection of lows) |
| Gravestone Doji | Upside down T | Long upper, short or no lower | Bearish (rejection of highs) |
Some traders say there are 3 types of doji and group the Standard and Long Legged together as simply “Doji.” Others insist on all 4 types of doji candles including both Dragonfly and Gravestone. Either way, the key is recognizing the shape and understanding what it says about market psychology. A Dragonfly at support? Pay attention. A Gravestone at resistance? Get ready. A Long Legged Doji after a quiet week? Buckle up. Something is about to move.
Doji in Different Markets: Stocks, Forex, and Crypto
Here is a truth that saves a lot of heartache. A Doji on a stock chart does not always behave the same way as a Doji on a forex pair. The market you trade matters. The doji in stock market acts differently than the doji in forex because the engines driving price are completely different. Stocks react to earnings, news, and sector trends. Forex reacts to interest rates, central banks, and economic data. Crypto reacts to tweets, whales, and pure vibes. Same candle shape. Three different personalities.
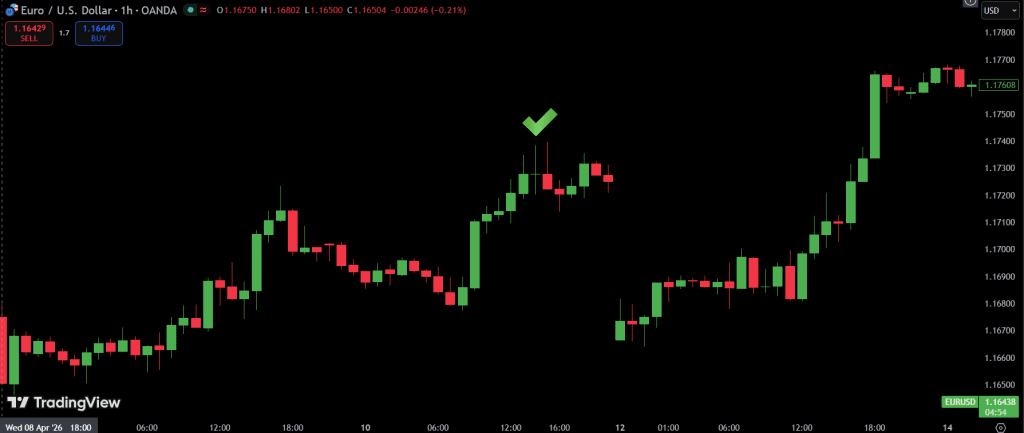
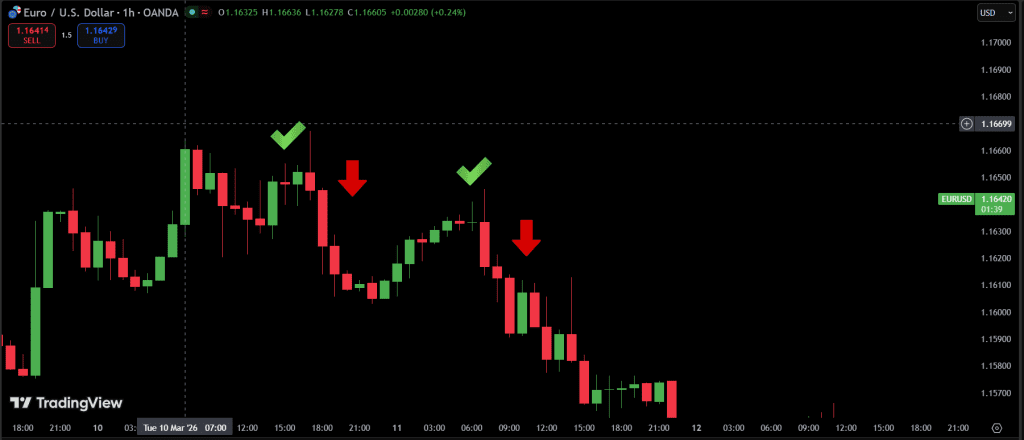
Let us walk through real world doji examples across different markets. Consider this your field guide. Not theory. Just how these patterns actually show up and what they mean depending on where you are trading.
Doji in Forex
The doji in forex is like a lie detector test for major news events. Forex markets run 24 hours a day, five days a week. Liquidity is massive. But even with all that money flowing, a Doji still forms when the market freezes before a big announcement. Think Federal Reserve rate decisions, non farm payroll reports, or inflation data. A long legged Doji right before these events screams “get ready for fireworks.” The market has no clue which way to go. So it sits still for a moment. Then it explodes. Forex traders love Dojis because they appear at key support and resistance zones on daily and four hour charts. A Dragonfly Doji at a major round number like 1.2000 on EUR/USD? That is a warning shot for a bounce.
Doji in Stock Market
The doji in stock market plays by slightly different rules. Individual stocks have personalities. Some are volatile. Some are sleepy. A Doji on Apple or Tesla means something different than a Doji on a small cap biotech stock. In blue chip stocks, a Gravestone Doji after a massive green rally often signals institutions are taking profits. They sell into strength. The party might be ending. In smaller stocks, Dojis appear more often because liquidity is thinner. One big buy order can create a long wick. So context matters even more here. The most reliable doji in stock market scenarios happen on the daily or weekly timeframe. A Dragonfly Doji at a 52 week low? Institutions might be defending that level. A Gravestone Doji at all time highs? Someone is selling the top.
Doji in Crypto
Crypto is the wild west. Dojis form constantly because the market is schizophrenic. One minute Bitcoin is up 5 percent. The next minute it is down 8 percent. Then back to even. A long legged Doji on a crypto chart happens almost every weekend when volume dries up. Here is the trick. Most crypto Dojis are noise. But the ones that matter appear on weekly charts or after massive liquidation events. A Dragonfly Doji on Bitcoin weekly after a 30 percent crash? That could be the bottom. A Gravestone Doji after a hype driven pump to a new all time high? That could be the top. Just remember. Crypto Dojis need confirmation more than any other market because fakeouts are the norm, not the exception.
10 Real Scenarios Across All Markets
To make this concrete, here are 10 examples of doji candlesticks in action across stocks, forex, and crypto. These are not made up. These are the setups professionals watch.
- Dragonfly Doji at support – Apple stock bouncing off its 200 day moving average. Bullish signal.
- Gravestone Doji at resistance – EUR/USD hitting a two year high and rejecting it. Bearish signal.
- Long legged Doji during Fed announcement – GBP/USD freezing before Jerome Powell speaks. Volatility incoming.
- Standard Doji inside a range – Tesla trading sideways for two weeks. No signal. Ignore it.
- Dragonfly Doji after a crash – Bitcoin down 40 percent from highs, forms weekly Dragonfly. Potential bottom.
- Gravestone Doji after a parabolic rally – NVIDIA up 200 percent in six months, forms Gravestone at all time highs. Profit taking begins.
- Long legged Doji on low volume – A random altcoin on a Sunday. Meaningless. Move along.
- Dragonfly Doji at a round number – USD/JPY at 150.00. Buyers defend the level hard.
- Gravestone Doji after earnings beat – Amazon beats estimates, spikes up, then closes flat. Smart money sold the news.
- Standard Doji with high volume – S&P 500 at a record high with huge volume. Indecision at the top. Caution warranted.
Which Market Gives the Best Signals?
Forex wins for reliability. The doji in forex on daily charts with high volume is a rock solid signal because the market is deep and manipulated by big institutional players. The doji in stock market comes in second. It works great on blue chips but gets messy with small caps. Crypto is last. The signals work but only on weekly timeframes and only with strict confirmation rules. Choose your battlefield wisely. A Doji is only as good as the market it lives in.
How to Trade Doji Candlestick Patterns
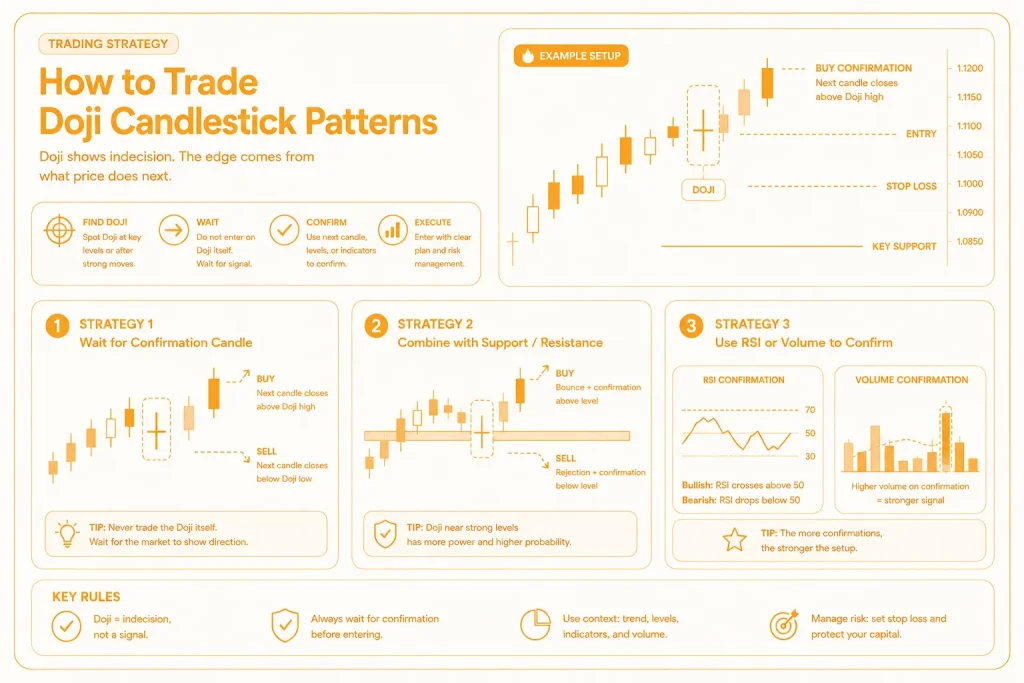
Knowing what a Doji looks like is one thing. Knowing how to trade doji candlestick patterns is where the real money gets made or lost. Beginners see a Doji and jump in immediately. That is a fast track to getting chopped up. Professionals know better. They wait. They plan. They stack the odds in their favor before pulling the trigger. Let us break down three battle tested strategies for doji trading that actually work in real markets. These are not theory. These are methods used by traders who eat what they kill.
Strategy 1: Wait for Confirmation
This is the golden rule of doji in trading. Never ever trade a Doji based on the Doji alone. Ever. The Doji is a question mark, not an answer. Confirmation comes from the next candle. Here is how it works. You spot a Gravestone Doji after a long uptrend. You think prices might go down. But you do not sell yet. You wait for the next candle to close below the Doji’s low. That is confirmation. The sellers showed up and meant business. Same thing with a Dragonfly Doji after a downtrend. Wait for the next candle to close above the Doji’s high. That tells you buyers have taken control. No confirmation? No trade. Simple as that.
Strategy 2: Combine with Support and Resistance
A Doji in the middle of nowhere is useless. A Doji sitting right on a major support level? That is gold. Support is a price floor where buyers have historically stepped in. Resistance is a ceiling where sellers have historically slammed the door. When you see a Dragonfly Doji forming exactly on a support level, you have two reasons to be bullish instead of one. The support says buyers like this area. The Doji says sellers tried to push lower and failed. Together, they form a high probability setup. Same logic for a Gravestone Doji at resistance. The resistance says sellers are waiting there. The Doji says buyers tried to break through and got rejected. That is a powerful sell signal.
Strategy 3: Use RSI or Volume to Confirm
Now we add filters to separate high probability trades from low probability guesses. The Relative Strength Index (RSI) is your friend here. A Dragonfly Doji after a downtrend is nice. But a Dragonfly Doji after a downtrend with RSI below 30 (oversold territory) is even better. You are not just seeing indecision. You are seeing indecision at a moment when history says reversals are likely. Volume is another powerful filter. A Doji on low volume is probably noise. Institutions are not involved. But a Doji on high volume? That means big money is fighting. Someone knows something. Volume confirms that the indecision matters. High volume Doji at a key level followed by a confirmation candle? That is a trade worth taking.
Putting It All Together
Here is a simple checklist for how to trade doji candlestick patterns like a pro.
- Identify the trend. Is it an uptrend or downtrend?
- Spot the Doji type. Dragonfly? Gravestone? Long legged?
- Check location. Is it at support or resistance?
- Look at RSI. Is it oversold or overbought?
- Check volume. Is it above average?
- Wait for confirmation. Next candle closes beyond Doji high or low.
- Enter the trade. Place your stop loss beyond the Doji’s opposite wick.
That is it. No magic. No secret sauce. Just discipline and patience. The market will give you plenty of Dojis every single week. You do not need to trade all of them. You only need to trade the ones that check every box.
Psychology Behind Doji Candlestick
Let us climb inside the mind of a trader watching a Doji form in real time. The psychology behind doji candlestick formation is a roller coaster of emotion, fear, and second guessing. Understanding this mental game is what separates the sheep from the wolves. So why doji candlestick patterns even exist? Because humans are indecisive creatures. And the market is just a giant mirror of human emotion.
Here is the step by step emotional journey during a Doji formation.
Step 1: The Opening Bell. The session starts. Bulls are optimistic. Bears are skeptical. Both sides place their bets. Price begins moving in one direction. Let us say it goes up. The bulls are feeling good. Chests are puffed out.
Step 2: The Counterattack. Suddenly, the bears show up. They push price back down. Maybe even below the open. The bulls start sweating. The bears are grinning. But then the bulls fight back again. This tug of war repeats. Maybe two times. Maybe five times. Each time, hope and despair alternate like a light switch being flipped on and off.
Step 3: The Exhaustion. By the middle of the session, both sides are tired. The early adrenaline is gone. Volume might dry up. Traders stare at their screens with blank faces. Nobody wants to make the first move anymore. Price floats sideways like a leaf on a still pond.
Step 4: The Closing Bell. Neither side could land a knockout punch. The open price and close price are nearly identical. The psychology behind doji candlestick patterns is now complete. Everyone is exhausted. Confused. Unsure what comes next. That exhaustion is exactly why what do dojis indicate matters so much. They indicate that the current trend has run out of gas. The engine is sputtering. The tank is empty. Whether the car rolls forward or backward next depends on who refuels first. But one thing is certain. The old speed is gone. That is the exhaustion of trend. And that exhaustion is pure gold for traders who know how to read it.
Common Mistakes
Even experienced traders mess up Dojis. Let us clean up the confusion and fix the most common errors. Plus answers to the questions that pop up again and again.
Two Big Mistakes to Avoid
Mistake 1: Trading Doji alone without confirmation. This is the number one account killer. A Doji is a warning sign, not a trigger. Trading it without waiting for the next candle to confirm is gambling, not trading. You will get whipsawed. You will get frustrated. You will lose money. Always always always wait for confirmation.
Mistake 2: Ignoring the trend. A Doji against the trend is a trap. Imagine a strong uptrend with higher highs and higher lows. Then a tiny Doji appears. Some traders scream “reversal!” and short the market. Then price rips higher and blows up their account. Why? Because the trend is your friend. Dojis that go against the prevailing trend fail more often than they succeed. Always check what came before. Trade with the trend, not against it.
Conclusion
The Doji candlestick is one of the most powerful tools in technical analysis, but only when used correctly. Remember: a Doji alone is neither bullish nor bearish. It is a signal of indecision. Whether it becomes a reversal pattern depends entirely on the preceding trend and subsequent confirmation. Master the types of Doji candles from Dragonfly to Gravestone and combine them with volume or support and resistance. Trade wisely, and let the Doji show you where the market might change its mind.
FAQ
What does a Doji mean in trading?
It signals indecision between buyers and sellers. The open and close prices are nearly equal.
What does a Doji candle indicate?
It indicates market confusion, a potential trend reversal, or a pause in momentum.
Is Doji a reversal pattern?
Yes, it is considered a potential reversal pattern, but confirmation from the next candle is required.
Is Doji bullish or bearish?
Neutral. A Dragonfly Doji after a downtrend is bullish; a Gravestone Doji after an uptrend is bearish.
What do Dojis indicate about market psychology?
They show that neither bulls nor bears could gain control, leading to a standoff.
What do Doji candles mean in forex?
Same as other markets. Indecision. Often appears before major economic news.
How do Dojis work in a trading strategy?
They work as early warning signals. Traders wait for a strong candle in the opposite direction to confirm.
What should a Doji do to be valid?
The open and close must be very close, within a few ticks. Long wicks increase significance.
Is Doji a real word?
Yes, it is a standard term in financial trading, derived from Japanese “dōji” which means same period.
What do Dojis show about volatility?
Long legged Dojis show high volatility. Short Dojis show low volatility.

