Bollinger Bands
Mean Reversion
Markets have a short memory and a bad temper. Price spikes up on hype, crashes down on fear, and through it all, the one thing that never changes is this: what goes way up usually comes back down. That pull to the middle, the quiet average, is called mean reversion, and it is one of the most reliable patterns you can trade. The Bollinger Bands mean reversion strategy turns that simple idea into a step by step system, showing you exactly when price has gone too far and is about to snap back like a stretched rubber band.
Here is what most beginners get wrong: they think trading is all about catching big breakouts or jumping on hot trends. But chasing price is exhausting, and more often than not, you end up buying the top or selling the bottom. The smarter move? Let the crowd panic, then step in when everyone else is scared. The Bollinger Bands mean reversion strategy does the heavy lifting for you. It highlights the extremes, filters out the noise, and helps you fade the hype with confidence. No PhD in math required, just a little patience and a plan.
What Is Mean Reversion in Trading?
Let’s cut to the chase. Mean reversion is just a fancy way of saying “what goes up too fast usually comes back down, and what drops like a rock tends to bounce.” Think of price like a dog on a leash. The owner (the mean or average) walks a straight line, but the dog zigzags, runs ahead, falls behind, then snaps back. That snapback? That is mean reversion Bollinger traders’ bread and butter.
Here is the beauty of it. You do not need to predict where price is going next year, next month, or even next week. You just need to spot when the dog has run too far from the owner. Markets are emotional creatures. Fear makes price overshoot to the downside. Greed sends it rocketing too high. But eventually, reality checks in, and price returns to the average like a homesick pigeon. That predictable loop, extreme to average and back again, is the entire heartbeat of mean reversion trading.
The best part? You do not fight the market. You let it wear itself out, then you step in when everyone else is panicking. No heroics. No crystal ball. Just patience, a basic rule, and the guts to fade the crowd.
Understanding Bollinger Bands for Reversion Signals
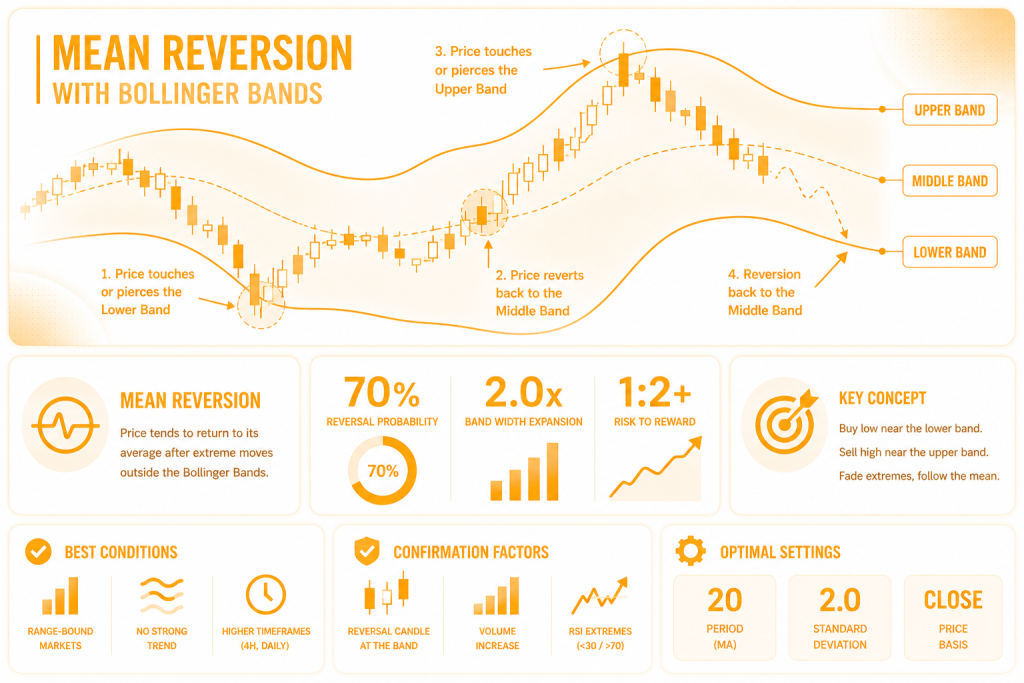
So how do you actually spot mean reversion in real time without staring at charts until your eyes cross? Enter Bollinger Bands, one of the handiest tools in any trader’s toolbox. Created by John Bollinger, these bands wrap around price like a wetsuit. They consist of three lines: a middle line (the average, usually a 20 period simple moving average), an upper band, and a lower band. The magic happens with the upper and lower bands. They expand and contract based on volatility. When price touches or pokes outside those bands, it is waving a red flag saying, “Hey, I might be running too hot or too cold.”
Now here is where the rubber meets the road. Most newbies see price hit the upper band and think, “Buy! It is going higher!” Wrong. That is chasing. The whole point of Bollinger Bands mean reversion is to do the opposite. When price tags the upper band, you start looking for a sell or short opportunity because history shows price will likely fall back toward the middle. When price tags the lower band, you start looking to buy. You are not guessing a trend. You are betting on a snapback. Simple as that.
But do not get it twisted. Price can hug the band for a while before reversing. That is why you never blindly jump in the second price touches the band. You wait for confirmation, like a reversal candle or momentum slowing down. Think of the bands as a warning light, not a launch signal. They tell you when the market is stretched too thin. From there, it is your job to pull the trigger with patience and discipline. Use Bollinger Bands mean reversion the right way, and you stop chasing price. Instead, you let price come to you like a boomerang.
Core Rules of the Mean Reversion Bollinger Strategy
Alright, enough theory. Let’s talk rules. You cannot just wing it and hope for the best. That is gambling, not trading. The mean reversion Bollinger Bands approach lives and dies by a few simple, nonnegotiable rules. Nail these down, and you will trade with structure instead of emotions.
Rule 1. Only Trade in a Ranging Market
If price is making higher highs and higher lows like a mountain climber, do not fade it. Trends crush mean reversion traders. So check first. Is the market moving sideways? Are the Bollinger Bands running flat instead of pointing sharply up or down? If yes, you have the green light. If no, walk away. The mean reversion Bollinger Bands strategy only works when the market has no strong direction. There is always another trade tomorrow.
Rule 2. Wait for Price to Touch or Close Outside the Band
Do not jump the gun. Let price stretch its neck out. The more extreme the touch, the better the reversion odds. But here is the kicker. Never enter the second price touches the band. That is a trap. A smart mean reversion Bollinger Bands trader waits for price to overextend first, then strikes.
Rule 3. Always Wait for Confirmation
You need a reversal signal. A bullish candle on the lower band, like a hammer or an engulfing pattern. A bearish candle on the upper band, like a shooting star or a bearish engulfing. No confirmation, no trade. Without this filter, your mean reversion Bollinger Bands setup becomes a guessing game. Simple as that.
Rule 4. Set a Tight Stop Loss
Place your stop just beyond the band you are trading from. If you buy at the lower band, put your stop a few ticks below it. If the trade goes against you, the band was wrong. Get out fast. Live to trade another day. Remember, even the best mean reversion Bollinger Bands signal fails sometimes. Respect your stop.
Rule 5 – Take Profit at the Middle Band
Do not get greedy. The middle band, the simple moving average, is your target. Price usually snaps back to the average, not through it. Take your profits there and walk away. Let the next trader chase the last penny. That is the whole point of the mean reversion Bollinger Bands strategy: small, steady wins.
How to Enter and Exit Trades
You have the rules. Now let’s get down to the nitty gritty. Knowing when to pull the trigger and when to run for the hills separates the rookies from the real traders. Mean reversion using Bollinger Bands is not just about spotting a touch of the band. It is about timing your entry like a pro and knowing exactly where to get out before the market humbles you.
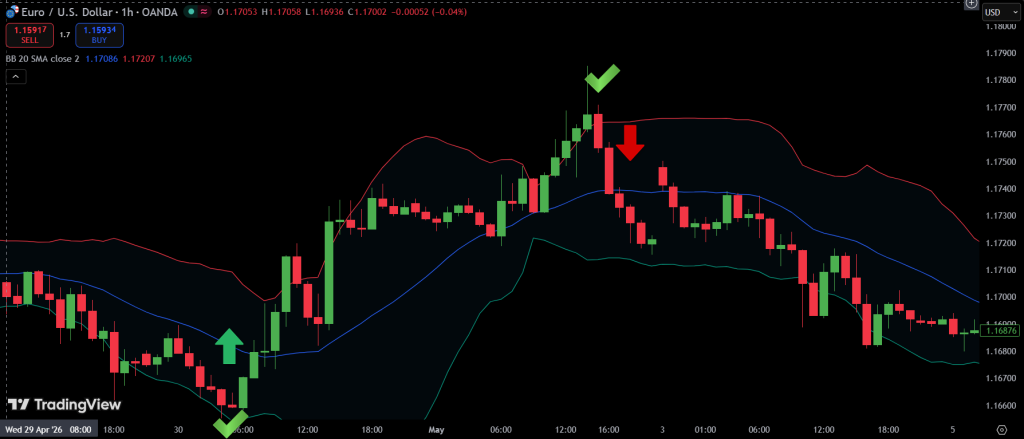
The Entry. Wait for the Touch, Then Wait Again
Here is where most traders mess up. They see price tag the lower band and instantly smash the buy button. Big mistake. Price can kiss the band and keep falling like a knife. So what is the move? Wait for price to touch the band. Then wait for a reversal candle to close. That candle is your green light. When you practice mean reversion using Bollinger Bands, you enter on the open of the next candle. No chasing, no guessing, no panic.
The Stop Loss. Your Seatbelt
Place your stop loss just a few ticks outside the band. If you bought at the lower band, put your stop below the recent low or below the band itself. If price blows past that level, your trade idea is dead. Bury it and move on. Smart mean reversion using Bollinger Bands traders lose small and live to fight another day.
The Take Profit. Middle Band or Bust
Do not get cute. Your first profit target is the middle band, the 20 period moving average. Price almost always snaps back to that line like a yo yo. Set your limit order there and walk away. Can price go beyond the middle band? Sure. But that is not your business. Your business is capturing the meat of the reversal, not the bone. With mean reversion using Bollinger Bands, you eat and leave the table.
Scaling Out. A Pro Move
If you want to get fancy, scale out. Take half your profit at the middle band. Then let the other half ride toward the opposite band. But here is the catch. Move your stop to break even first. This way, you lock in a free trade. That is how experienced traders squeeze extra juice from mean reversion using Bollinger Bands without getting burned.
When to Stay on the Sidelines
Not every touch is a trade. If volatility is exploding and bands are widening like a snake unhinging its jaw, step back. If news just dropped and the market is in freakout mode, step back. Mean reversion using Bollinger Bands thrives in calm, sideways markets. In a storm, even the best setup sinks.
Common Mistakes and Filters
Let’s be real for a second. You will mess up. Everyone does. But you can mess up less if you know what trips people up ahead of time. The mean reversion strategy with Bollinger Bands is powerful, but it has plenty of potholes. Below are the most common mistakes traders make, followed by simple filters to keep you on the straight and narrow.
- Mistake #1: Trading every single band touch. Not every touch is a gift. Sometimes price touches the band and just keeps going like a freight train. Newbies see a touch and jump in without thinking. That is a fast way to lose money.
The filter: Add an oscillator like RSI. Only take a long trade when price touches the lower band and RSI is below 30 (oversold). Only take a short trade when price touches the upper band and RSI is above 70 (overbought). This simple filter keeps you out of false signals. That is the backbone of any solid mean reversion strategy with Bollinger Bands. - Mistake #2: Ignoring the bigger trend. You cannot fade a freight train. If the daily chart is in a strong uptrend and price touches the lower band, that might be a pullback, not a reversal. Selling the upper band in a bull market is suicide.
The filter: Check the higher time frame first. If the weekly or daily trend is up, only look for buy signals at the lower band. If the trend is down, only look for sell signals at the upper band. A smart mean reversion strategy with Bollinger Bands respects the boss, the higher time frame trend. - Mistake #3: No confirmation candle. Entering the second price touches the band is like jumping into a pool before checking if there is water. Price can touch, bounce, touch again, then crash right through. You need proof that the market is turning.
The filter: Wait for a reversal candle to close. A hammer, a bullish engulfing, a shooting star, or a bearish engulfing. Then enter on the next candle. No candle, no trade. Patience separates winners from gamblers in the mean reversion strategy with Bollinger Bands. - Mistake #4: Holding too long. Greed is a dream killer. You take a trade, price snaps to the middle band, and you think, “Maybe it will go all the way to the other band.” Then it reverses and eats your profit. You end up with nothing or worse, a loss.
The filter: Take profit at the middle band. No questions. No second guessing. Get out and be happy. If you want more, scale out. Take half at the middle, then let the rest ride with a stop at break even. But never let a winning trade turn into a loser. Discipline is the secret sauce of the mean reversion strategy with Bollinger Bands. - Mistake #5: Using a stop that is too tight. Some traders panic and put their stop one penny below the band. Then price wiggles, hits the stop, and reverses right after. They get stopped out for no reason while the market laughs at them.
The filter: Give your trade breathing room. Place your stop a few ticks below the recent swing low or above the recent swing high. Or use the Average True Range (ATR) to set a stop that respects market noise. A stop that is too tight will kill your mean reversion strategy with Bollinger Bands faster than bad entries. - Mistake #6: Trading during high impact news. Economic reports, Fed announcements, earnings bombs. These events blow up mean reversion setups. Price can spike through bands and never look back. You will get steamrolled.
The filter: Check the economic calendar before every trading session. Avoid trading 30 minutes before and 30 minutes after major news. Let the dust settle. The market will still be there tomorrow. A patient mean reversion strategy with Bollinger Bands avoids the news roulette wheel. - Mistake #7: No plan for when the trade fails. Hope is not a strategy. Too many traders freeze when price blows past their stop. They stare at the screen, do nothing, and watch their account shrink.
The filter: Have a written rule. If price closes beyond the band two candles in a row, the reversion is dead. Get out. No arguments. No “maybe it will come back.” Respect your stop like it is a law. That is the final piece of a mature mean reversion strategy with Bollinger Bands.
Conclusion
The Bollinger Bands mean reversion strategy works best in ranging or sideways markets. It is not a momentum approach. Instead, it profits from overextended prices snapping back to the mean like a rubber band letting go. Always combine with volume or RSI confirmation to avoid catching falling knives. Remember, no strategy works every time. But with patience, discipline, and the rules you just learned, you can turn market tantrums into your steady edge. Trade small, trade smart, and let the crowd chase while you fade.
FAQ (Frequently Asked Questions)
Does the mean reversion strategy work in all market conditions?
No. This strategy only works in ranging or sideways markets. In strong trends, price can hug the band for a long time and never revert. Always check the higher time frame before taking a signal.
How long should I wait for price to revert after touching the band?
There is no set time. Sometimes price snaps back within one or two candles. Other times it can hug the band for several candles before reversing. That is why you always wait for a confirmation candle and use a stop loss. Patience is nonnegotiable.
Can I use this strategy on any timeframe?
Yes, but it works best on higher timeframes like the 1 hour, 4 hour, and daily chart. Lower timeframes like 1 minute or 5 minutes have too much noise and fake signals. Beginners should stick to the daily chart.
What is the win rate of the Bollinger Bands mean reversion strategy?
There is no magic number. With good filters like RSI and trend confirmation, experienced traders see 60 to 70 percent of their trades work. But no strategy wins every time. That is why risk management matters more than win rate.
How much capital should I risk per trade?
Most pros risk 1 to 2 percent of their account per trade. If you have a 10,000 dollar account, that means risking 100 to 200 dollars. Never bet the farm on one trade. Even the best mean reversion signal can fail.
What happens if price never reverts?
That is what your stop loss is for. If price closes beyond the band two candles in a row, the reversion is dead. Take the small loss and move on. Living to trade another day is more important than being right.
Can I use this strategy on crypto, stocks, or forex?
Yes. The mean reversion strategy works on any market that moves sideways from time to time. Crypto, stocks, forex, futures, ETFs. The instrument does not matter. The market behavior does.
Do I need fancy software or paid indicators?
No. Bollinger Bands come standard on every trading platform like TradingView, MetaTrader, ThinkorSwim, and Webull. Free is fine. The strategy is free too. You just need patience and discipline.

