Double Shooting
Star Pattern
Imagine you are at a carnival and someone fails twice in a row to knock over the milk bottles. The second miss tells you more than the first. It tells you the game is rigged. Trading has the same logic. When the market tries to rally and fails once, maybe it is just a bad day. But when it tries again and fails the exact same way? That is a trap. That is the double shooting star pattern snapping into place like a second lock on a jail cell.
Here is the beauty of it for a new trader. You do not need math or a dozen indicators. You just need to learn one shape. The double shooting star pattern looks like two candles with tiny bodies and long upper shadows. They appear after a price run up, and they scream the same thing twice: “We cannot go higher.” When you see that double failure, step aside or get ready for the drop. It is one of the rare patterns that hands you the answer on a silver platter.
What Is the Double Shooting Star Pattern?
Imagine a boxer who throws a punch, misses, and stumbles. Then he gets up and throws the exact same punch. And misses again. The second miss tells you more than the first. That is exactly what happens on your chart with this pattern. After an uptrend, the market tries to push higher. It fails. Then it tries again immediately. It fails again. That double failure is a neon sign flashing “turnaround.”
Structure of the Pattern
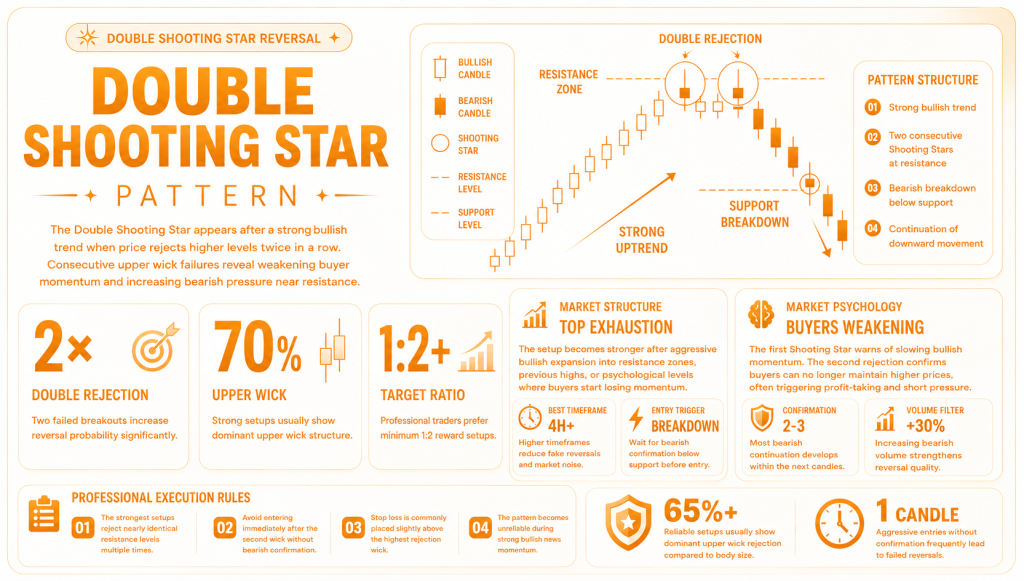
Two back-to-back shooting stars appear after an uptrend. Each candle has a small real body, a long upper wick (at least twice the body length), and almost no lower wick. Think of a shooting star as a rocket that blew up right after launch. It went up, got crushed, and left a long streak of smoke behind. Now see two of them side by side. That is not an accident. That is the double shooting star pattern loading up.
Why “Double” Matters
A single shooting star can fool you. Sometimes it is just noise. But the double shooting star pattern gives you a second opinion for free. Buyers tried to push prices higher two times in a row and got slapped back two times in a row. After the second slap, the sellers smell blood. They step in with confidence. That is why the double version is a stronger, cleaner, and more reliable reversal signal than its lonely cousin.
How to Identify a Reliable Signal
Not every pair of shooting stars is a golden ticket. You need the right conditions. Otherwise, you are chasing a ghost. Think of it like spotting a real diamond versus a piece of glass. They might look similar at first glance, but the real one has rules. Here is what to look for so you do not get faked out.
Key Requirements
First, you need a clear prior uptrend. The pattern means nothing if prices have been going sideways or down. A reversal has to reverse something. Second, the second star’s close should be near or below the first star’s close. If the second star closes higher, buyers are still fighting back. That weakens the signal. Third, avoid a big gap up between the two stars. A small gap is fine if it fills quickly. But a large gap up means buyers got a second wind, and the double shooting star pattern might fail. Stick to these three rules, and you will dodge most of the fakeouts.
Visual Example
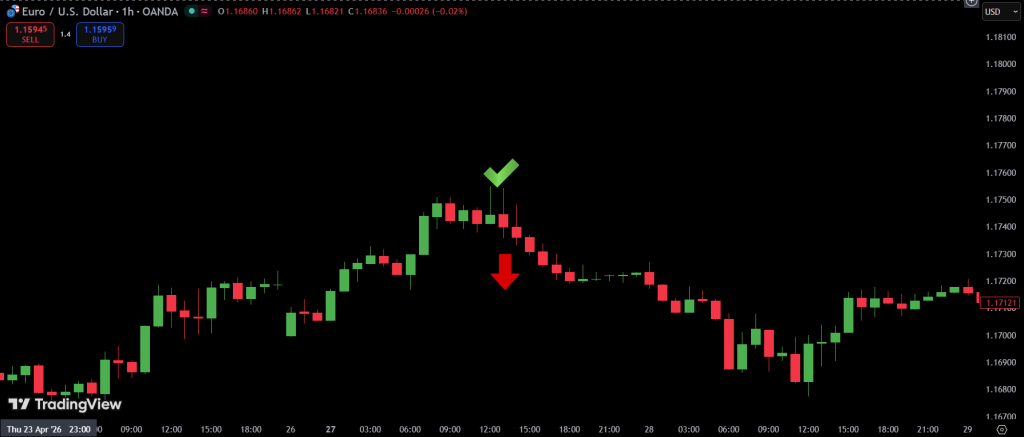
Picture this: price has been climbing for two weeks like a happy hiker. Then it hits a ceiling. A shooting star appears. The next day, price tries to break through that same ceiling again. But guess what? Another shooting star pops up right next to the first one. That is the double shooting star candlestick pattern in action. Two failures at the exact same level. The market is basically waving a white flag and saying, “I give up.” Now you know exactly what to look for on your own charts.
Trading the Double Shooting Star Pattern
Spotting the pattern is one thing. Trading it like a pro is another. Think of it as finding a treasure map. The map is useless unless you know where to dig. Here is your shovel. Follow these simple rules to turn the double shooting star pattern into real trades without losing your shirt.
Entry, Stop, Target
| What | Where | Why |
|---|---|---|
| Entry | Short (sell) below the second candle’s low | That is the moment sellers take control |
| Stop-loss | Just above the highest upper wick of the two stars | Gives price a tiny breathing room |
| Target | Nearest support level or 2:1 risk reward | Locks in profit before the bounce |
Here is a quick checklist before you pull the trigger:
- Wait for the second candle to close completely. No jumping the gun.
- Place your sell order one tick below the second candle’s low.
- Set your stop loss above the longer of the two upper wicks.
- Calculate your target. If your risk is 10 pips, aim for at least 20 pips.
- Walk away. Do not babysit the trade.
Confirmation Tools
The double shooting star pattern is strong on its own. But why not stack the odds in your favor? Add one or two confirmation tools and watch your win rate climb.
- Declining volume. Volume should drop on the second shooting star. That means buyers are running out of gas. No volume drop? Be careful.
- RSI divergence. Price makes a higher high, but RSI makes a lower high. That is a classic bearish divergence. When that lines up with the double shooting star, you have a rocket booster under your trade.
- Support and resistance. The pattern is twice as powerful if it forms at a known resistance level or a round number like 1.2000 or 100.00.
A quick rule of thumb: Get two confirmations, and you can trade with confidence. Get only the pattern itself? Take a smaller position. The market will still be there tomorrow.
Conclusion
The double shooting star candlestick pattern is like a smoke alarm that goes off twice. You do not ignore it. When identified correctly, it offers a clean, high-probability reversal setup that takes the guesswork out of selling near market tops. Unlike a single shooting star that can trick you with false hope, the double version filters out the noise and hands you a much clearer picture. Master this one pattern, and you will start spotting market peaks before they crumble. Trade it with discipline, and confidence will follow.
FAQ
Is the double shooting star pattern always bearish?
Yes, it is a strong bearish reversal signal. But here is the catch: it only works after a clear uptrend. If you try to use it in a sideways market or a downtrend, it will disappoint you like a broken umbrella on a rainy day. Stick to uptrend peaks, and it will treat you right.
How reliable is the double shooting star candlestick pattern?
Much more reliable than its single cousin. Think of it this way: one person says “I have a bad feeling”, maybe nothing happens. Two people say it? You start packing your bags. The double shooting star candlestick pattern delivers that second opinion. The double rejection confirms real selling pressure, giving it roughly 70 to 75 percent accuracy on daily charts. That is a number you can take to the bank.

