Bollinger Bands
Core Strategy
What Are Bollinger Bands? (Basics)
If you have ever stared at a price chart and felt like you were trying to read tea leaves, you are not alone. Bollinger Bands explained for beginners starts with a light bulb moment: prices don’t just move randomly; they breathe like a living thing. When markets get quiet, the bands squeeze tight like a coiled spring. When volatility explodes, they expand like a parachute catching wind. That is the secret sauce of how to use Bollinger Bands, reading that rhythm instead of guessing blindly.
Think of Bollinger Bands as a volatility GPS for stocks, crypto, or forex. They do not predict the future, but they show you when the market is snoring and when it is throwing a tantrum. In this guide, we will cut through the jargon and show you how to spot breakouts before they happen, catch reversals like a pro, and stop getting faked out by every little wiggle on the screen. No PhD in math required. Just curiosity and a few minutes of your time.
Let us start with the million dollar question: what are Bollinger Bands used for? In plain English, they help you figure out if the price is cheap, expensive, or just right compared to recent action. Imagine a rubber band wrapped around a price chart. That is basically a Bollinger Band. It stretches when things get wild and shrinks when the market takes a nap. The magic is in the three lines: an upper band, a middle band, and a lower band. Together, what do Bollinger Bands show? They show you the emotional state of the market, calm, frantic, or somewhere in between.
Now let us talk about how to read Bollinger Bands like a pro. When price kisses the upper band, think of it as a flashing yellow light, not a red one. It means the market is excited, but that does not always mean “sell immediately.” When price tags the lower band, the market is having a tantrum, but that is not always a buy signal either. That is where how to interpret Bollinger Bands gets interesting. You have to look at the whole picture, are the bands flat or sloping? Wide or narrow? And here is the kicker: how Bollinger Bands work is all about mean reversion. Prices tend to snap back toward the middle line like a dog returning to its owner. But when a strong trend kicks in, the dog keeps running. That is the beauty of it.
Before we go any further, a quick shoutout to the brain behind the tool. Who invented Bollinger Bands? A guy named John Bollinger back in the 1980s. He wanted something better than static support and resistance lines. So he built a dynamic system that adjusts itself based on volatility. Smart move, right? Today, John Bollinger is a legend in the trading world, and his bands are on almost every serious trader’s screen.
One last thing for the road: do not overthink it. If you can spot when a market is snoring versus when it is throwing a party, you are already halfway there.
Bollinger Bands Calculation & Settings
Alright, let us pop the hood and see what makes these bands tick. Do not worry. You do not need a math degree to get this. The Bollinger Bands calculation is actually pretty straightforward. You start with a simple moving average of the last 20 periods. That is your middle line. Then you measure how much price tends to wander away from that average. That wandering is called Bollinger Bands standard deviation. By default, you add two of those deviations to the moving average to get the upper band. Then you subtract two to get the lower band. That covers roughly 95% of all price movement. In other words, price usually stays inside the house. When it tries to climb out the window, you know something interesting is happening.
Now let us talk about Bollinger Bands default settings. The standard recipe is 20 periods and 2 standard deviations. You will see it written as Bollinger Bands 20 2 on most trading platforms. Why 20? Because John Bollinger found that 20 days gave the best balance between sensitivity and reliability. Why 2 standard deviations? Because it captures about 95% of price action without getting too trigger happy. That little combo, Bollinger Bands 2 standard deviations, is the bread and butter of thousands of traders worldwide. It works for stocks, crypto, forex, you name it.
Now let us meet the three lines face to face. The Bollinger Bands upper band lives above the price like a ceiling. When price punches through it, the market is overheating. But hold your horses. That does not always mean sell. Sometimes a strong trend just keeps running with the upper band as a moving target. The Bollinger Bands middle line is the backbone of the whole system. It is a 20 period simple moving average. Think of it as the market’s “fair value” or the calm center of the storm. And finally, the Bollinger Bands lower band sits below price like a floor. When price crashes through it, the market is throwing a panic sale. But again, not always a buy signal. In a steep downtrend, price can hug that lower band like a scared kitten.
Here is a pro tip. Watch how price behaves around these three lines. If it keeps bouncing off the middle line, you are in a range. If it walks along the upper or lower band, you are in a strong trend. The magic is in knowing which game you are playing.
Bollinger Bands Width & Volatility
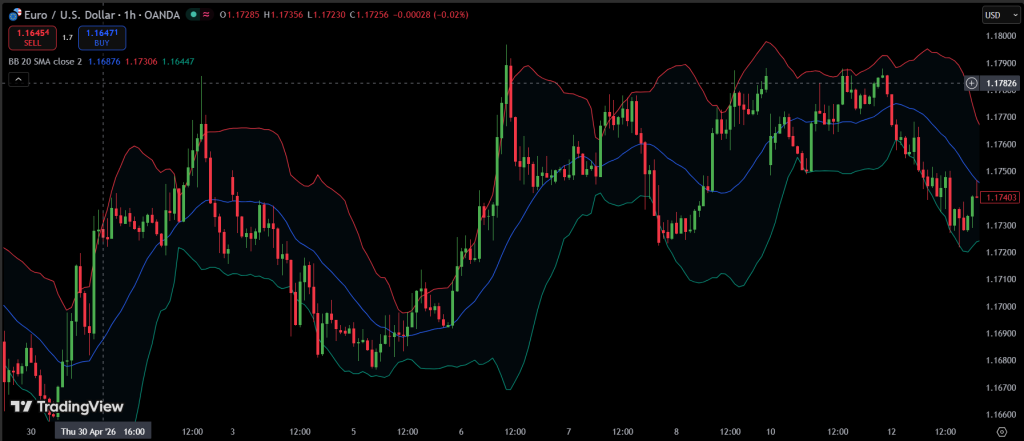
Let us talk about the secret sauce of the whole indicator. The magic is not just where price sits inside the Bollinger Bands. The real gold is in how fat or skinny the bands are. That measurement has a name: Bollinger Bands width. Think of it as a volatility thermometer. When the bands are wide, the market is screaming and throwing chairs. When they are narrow, the market is snoring on the couch. Simple, right?
The Squeeze: Your Early Warning System
Now pay close attention because this is where beginners make money and rookies lose it. When you see Bollinger Bands narrowing, something big is about to happen. I am not guessing. This is how volatility works. Low volatility is like a coiled snake. The longer it stays still, the harder it strikes. Bollinger Bands tightening means the same thing. The market is holding its breath. A squeeze is loading up. And that brings us to the most famous setup of all time: the Bollinger Bands squeeze. When the bands get super tight, like a python hugging its dinner, you know a massive move is coming. You do not know which direction, but you know it is coming. That is your cue to get ready.
What happens when Bollinger Bands narrowing goes on for too long? Patience. The squeeze can last for days or even weeks. Do not jump the gun. Wait for the actual breakout. Then you pounce.
From Calm to Storm: Reading the Expansion
On the flip side, when you see Bollinger Bands expanding, the market has already made its move. The snake has struck. The python has squeezed. Now price is running hard. Expanding bands mean high volatility and strong momentum. That is great if you are already in the trade. But be careful. Wide bands also mean the market could be exhausting itself.
Let me spell it out. What happens when Bollinger Bands narrow? Consolidation. The market is taking a nap before a marathon. What happens when Bollinger Bands widen? A trend is waking up. Price is moving with force. The trick is to spot the narrowing early, then catch the expansion as it happens. That is how you buy low volatility and sell high volatility. It is like buying cheap popcorn right before it pops.
One more thing. Do not confuse narrow bands with a quiet market that will stay quiet. In trading, calm always leads to storm. Always. The Bollinger Bands never lie about volatility. They just show you the truth. Your job is to believe it.
How to Use Bollinger Bands in Trading
Alright, let us get our hands dirty. You know what the bands are and how they move. Now it is time to actually trade with them. This is where the rubber meets the road. The Bollinger Bands are not fortune tellers. They will not text you “buy here” with a smiley face. But they will give you a massive edge if you know how to read the room. The secret sauce? Never trust a band touch alone. You need a second opinion from candlestick patterns. Let us break it down.
Overbought and Oversold: The Right Way to Trade Them
Most beginners think touching the upper band means sell immediately. That is a fast track to losing money. Here is the truth about Bollinger Bands overbought. When price tags the upper band, it simply means price is relatively high compared to recent action. That is all. In a strong uptrend, price can hug that upper band for days. The same goes for Bollinger Bands oversold. A touch of the lower band does not mean buy. In a nasty downtrend, price can keep kissing that lower band like a bad breakup.
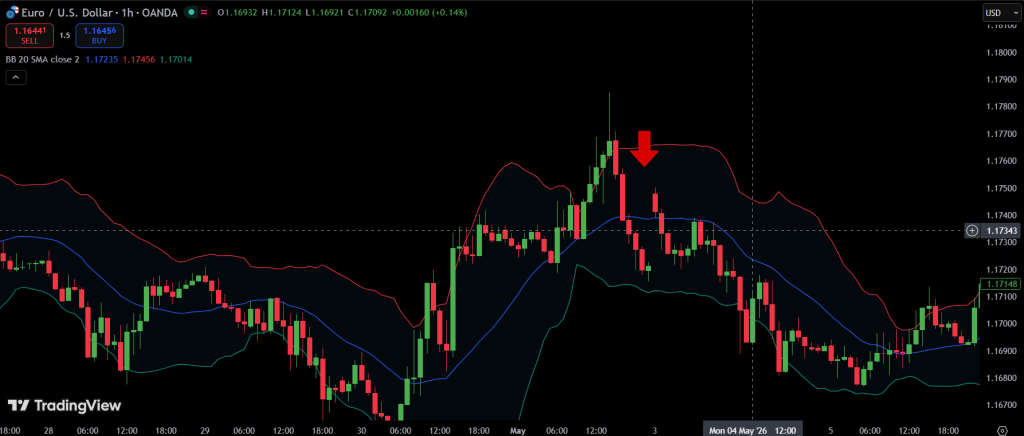
So how do you do it right? You wait for confirmation. When price touches the Bollinger Bands upper band, do not short yet. Look for bearish reversal candlestick patterns at the top. A shooting star, a bearish engulfing, or a dark cloud cover. Those are your red flags. If you see price tag the upper band and then form a shooting star on the same candle, that is your signal to sell. Without the candlestick confirmation, you stay on your hands. No exceptions.
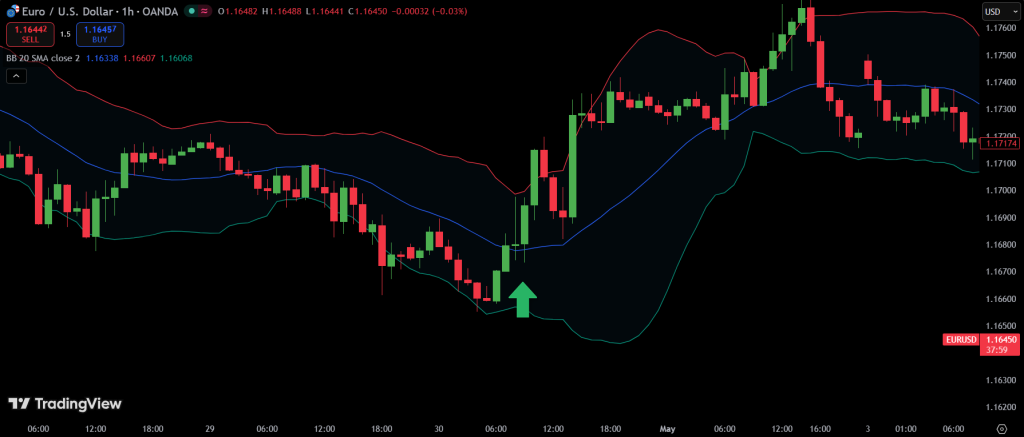
The same logic applies at the bottom. When price touches the Bollinger Bands lower band, do not buy immediately. Wait for bullish reversal patterns to show up. A hammer, a morning star, or a bullish engulfing candle. That is your green light. Price tags the lower band and then prints a beautiful hammer? Now you are talking. That is a high probability trade. The band tells you where. The candlestick tells you when.
Support and Resistance That Moves
Here is something beautiful. The Bollinger Bands give you dynamic Bollinger Bands support and resistance. That means the lines move with price. No more drawing horizontal lines that break five minutes later. The Bollinger Bands middle line often acts like a magnet. In a range bound market, price bounces off the upper band, falls to the middle line, finds support, then bounces again. That is money in the bank.
But here is the kicker. Even at the middle line, you want candlestick confirmation. A bounce off the middle line with a bullish engulfing candle? That is a buy. A rejection off the middle line with a bearish shooting star? That is a sell. The Bollinger Bands lower band can act as support in an uptrend. The upper band can act as resistance in a downtrend. But remember, when volatility explodes, those lines become trampolines, not brick walls. Watch how price reacts when it touches a band. Does it bounce hard with a nice pin bar? Does it slice right through like a hot knife through butter? That tells you everything about who is in control.
So, Are These Things Any Good?
Let us answer the big questions that every beginner asks. Are Bollinger Bands reliable? Yes, but only with confirmation. Alone, they are a coin flip. Add bearish or bullish candlestick patterns at the bands, and your win rate goes through the roof.
Do Bollinger Bands work in all markets? They work best in ranging markets that cycle between overbought and oversold. In strong trends, they can stay stretched for a long time. That is why you never fade a trend just because price touched a band. Wait for those bearish reversal candles at the upper band or bullish reversal candles at the lower band.
Is Bollinger Bands a good indicator? Absolutely. It is one of the top five indicators ever created. But only if you understand one thing. Are Bollinger Bands a lagging indicator? Yes, they are. The middle line is a moving average, and moving averages follow price. They do not lead. That is fine. You do not need to predict the future. You just need to react faster than everyone else. And candlestick patterns give you that speed.
One pro tip to walk away with. Use the Bollinger Bands with candlestick patterns and volume. The bands tell you where to look. The candles tell you when to pull the trigger. Volume tells you if the move is real. Together, they are a dream team. Bearish patterns at the upper band? Watch out below. Bullish patterns at the lower band? Buckle up for a ride higher.
Advanced Strategies & Common Questions
You have made it to the big leagues. This is where we stop playing defense and start playing offense. The basic stuff works, but the real money is made when you understand how to combine signals, read the squeeze like a pro, and avoid the dumb mistakes that eat beginners alive. Let us get into it.
The Squeeze Play: Your High Probability Setup
Remember the Bollinger Bands squeeze from Chapter 3? Low volatility, tight bands, coiled spring. That is your hunting ground. But here is how you turn that squeeze into cash. First, you wait for the bands to get narrower than they have been in the last 20 periods. Real narrow. Like a flattened snake narrow. Then you do nothing. You wait like a fisherman. The moment price breaks out above the upper band with a strong bullish candle, you go long. If it breaks below the lower band with a bearish candle, you go short.
But do not jump in blind. Here is the pro move. Wait for a retest. Price breaks out, then comes back to kiss the band again. That is your entry. And do not forget your candlestick confirmation. A break above the upper band with a bullish engulfing candle? That is beautiful. A break below the lower band with a bearish engulfing? Even better. The Bollinger Bands narrowing before the squeeze tells you something big is coming. Your job is to be ready when it arrives.
The Walk on the Band: Trending Like a Pro
Sometimes price does not bounce off the bands. Sometimes it walks along them like a tourist on the boardwalk. That is called a “walk on the band.” In a strong uptrend, price can hug the Bollinger Bands upper band for days. In a strong downtrend, it can ride the Bollinger Bands lower band like a sled down a hill.
Most beginners see this and panic. They think “overbought” and sell too early. Do not be that person. When price walks the upper band, you stay long until you see a bearish reversal pattern. A shooting star, a bearish engulfing, a hanging man. That is your exit signal. The trend is your friend until the candlestick says goodbye. The same goes for walking the lower band. Stay short until you see a bullish reversal pattern like a hammer or a morning star. Let the candles tell you when the walk is over.
Putting It All Together: A Simple Trading Checklist
Let me give you a Bollinger Bands trading strategy that works for beginners and pros alike. Here is your step by step checklist for a long trade.
First, wait for price to touch the Bollinger Bands lower band. Second, look for a bullish reversal candlestick pattern right at that lower band. A hammer or a bullish engulfing is your best friend. Third, check the middle band. Is it flat or pointing slightly up? That is a green light. Fourth, enter on the close of the bullish candle. Fifth, place your stop loss below the low of that hammer or engulfing candle. Sixth, take profit at the Bollinger Bands middle line for a quick flip, or wait for a touch of the upper band for a bigger move.
For a short trade, flip the script. Price touches the Bollinger Bands upper band. You see a bearish reversal pattern like a shooting star or a bearish engulfing. The middle band is flat or pointing down. You enter on the close of the bearish candle. Stop loss above the high of that candle. Take profit at the middle line or the lower band.
That is it. No magic spells. No thousand dollar indicators. Just Bollinger Bands, candlesticks, and discipline.
Conclusion
You now know more about Bollinger Bands than most traders learn in years. The secret is not complicated. Wait for the touch. Wait for the candle. Then pull the trigger. A bearish reversal at the top or a bullish hammer at the bottom. That is it. John Bollinger built a brilliant tool, but a tool is only as good as the person using it. Go put in the screen time. You have got this.
FAQ
1. What are Bollinger Bands used for?
Bollinger Bands help you spot volatility and see if price is relatively high or low. Think of them as a reality check for overbought and oversold conditions.
2. How to read Bollinger Bands?
It is simple. Top band is the ceiling. Bottom band is the floor. Middle line is the average. Price likes to stay inside, but when it breaks out, pay attention.
3. Are Bollinger Bands reliable?
Yes, but do not use them alone. They are rock solid for volatility. For entries, wait for a candlestick confirmation. That is where the magic happens.
4. What happens when Bollinger Bands narrow?
That is called a Bollinger Bands squeeze. The market is coiling up like a spring. A big move is coming. You just do not know which way yet.
5. Do Bollinger Bands work for day trading?
Absolutely. The default Bollinger Bands 20 2 works great on 5 minute or 15 minute charts. Just remember to use those candlestick confirmations.
6. Is Bollinger Bands a good indicator for crypto?
One of the best. Crypto loves volatility, and Bollinger Bands were built to measure exactly that. Just keep an eye on those fakeouts.
7. Are Bollinger Bands a lagging indicator?
Yes, they are. The middle line is a moving average, so it follows price. That is not a bug. That is just math. Use it for context, not predictions.
8. Who invented Bollinger Bands?
John Bollinger back in the 1980s. He got tired of static support and resistance lines and built something better. Legend move.
9. What is the best Bollinger Bands trading strategy for beginners?
Wait for price to touch the lower band. Look for a hammer or a bullish engulfing candle. Then buy. Stop loss below the hammer low. Take profit at the middle line. Simple and solid.
10. How to use Bollinger Bands with candlestick patterns?
Top band plus a shooting star or bearish engulfing? That is your sell signal. Bottom band plus a hammer or bullish engulfing? That is your buy signal. No confirmation, no trade.

