Inverted Hammer
Pattern Setup
Picture this: the market has been falling for days. Sellers are having a field day, pushing prices lower like a runaway truck down a steep hill. Everyone feels the pressure. Then, out of nowhere, a strange candle appears. It has a long upper wick reaching for the sky but a tiny body sitting near the bottom. That odd looking candle has a name. It is called an inverted hammer candlestick. It looks like someone tried to hammer prices upward but got pulled back down. Here is the kicker: this little candle might just be the first sign that the downtrend is running out of gas.
So, is inverted hammer bullish or bearish? The answer might surprise you. Even though the candle closed near its low, it is actually a bullish signal. But there is a catch. It only works when it shows up at the bottom of a downtrend or at a support level. Think of it like a boxer who has been losing the whole fight but suddenly lands a hard punch. He still lost the round, but you can see his opponent is wobbling. That is the inverted hammer in a nutshell. This guide will walk you through how to spot it, what it really means, and how to trade it without getting fooled. No fluff, just the good stuff.
What is an Inverted Hammer Candlestick? (Definition & Meaning)
Let us start with the basics. Every candlestick tells a story. It has four key pieces of data: the Open (where the candle began), the High (the highest price hit), the Low (the lowest price hit), and the Close (where the candle finished). The inverted hammer candlestick meaning comes entirely from how these four points line up.
The Anatomy of an Inverted Hammer Pattern
Here is what you are looking for:
- Long upper wick – At least two times the length of the body. Often three or four times longer.
- Small real body – Sitting at the bottom of the candle’s range.
- Little to no lower wick – The low and the close (or open) are very close together.
- Color does not define the pattern – Can be green or red.
Think of it like a failed rocket launch. The price shot up during the session (long upper wick) but could not stay there. It fell back down to the launchpad (small body at the bottom). That is the candlestick inverted hammer shape in a nutshell.
What Does This Pattern Mean in Trading?
Here is the real magic. In inverted hammer trading, this shape sends a clear message when it appears after a downtrend.
| What happens | What it means |
|---|---|
| Price has been falling for a while | Sellers are tired but still in control |
| Buyers suddenly push price way up | Demand is waking up |
| Sellers fight back and price drops | Bears are not dead yet |
| Price still closes near the bottom | The battle is not won |
| But price DID go higher during the session | This is the key signal |
The inverted hammer pattern tells you that buyers tried to take over. They did not succeed fully, but they proved something important. They proved that sellers can no longer keep price pinned down. That is a crack in the armor. That is why this pattern is a reversal warning, not a continuation signal.
Does Color Matter? Green vs Red Inverted Hammer
Many beginners get stuck on this question. Here is the short answer. Color matters a little, but location matters a lot.
A green inverted hammer (close above the open) means buyers actually won the battle inside that single candle. They pushed price up and kept some of those gains. That is slightly more bullish.
A red inverted hammer (close below the open) means sellers dragged price back down by the end of the session. The long upper wick still shows a buyer attack, but the bears won the close. This is still a valid reversal signal, just a bit weaker.
Either way, do not buy or sell based on color alone. Wait for confirmation on the next candle. That is where real inverted hammer trading begins.
The Psychology Behind the Inverted Hammer
Candlesticks are not just shapes. They are stories about fear and greed. Every single candle shows you a battle between buyers and sellers. The psychology of inverted hammer is one of the most fascinating stories in trading because it looks like a loss but actually signals a win.
Let me walk you through what happens inside that candle, minute by minute.
Step By Step: The Intraday Story
Step 1: The downtrend is in progress. Sellers are confident.
Price has been falling for hours, days, or weeks. Every time someone buys, sellers smash price back down. The crowd is pessimistic. Bears feel invincible. They think the downtrend will never end.
Step 2: The candle opens near the low. Sellers are still active.
A new trading session begins. Price opens close to the previous low. Sellers immediately try to push even lower. So far, nothing has changed. The bearish story continues.
Step 3: Buyers aggressively push price up. The long wick forms.
Suddenly, something shifts. Buyers storm in. They shove price higher and higher. That long upper wick you see? That is real buying pressure. Real money stepping in. Real traders saying “enough is enough.”
Step 4: Sellers return but cannot close below the open.
The bears fight back. They push price down from those highs. But here is the critical detail. When the session ends, price cannot close below the open. It closes near the bottom, yes. But not lower than where it started. That is a failure for the sellers.
Why This Setup Is Actually Bullish
Now you understand what happened. But why is inverted hammer bullish? It seems like sellers won the day, right? Wrong.
Think about it this way. For the entire downtrend, sellers had total control. Price could not go up at all. Then suddenly, during this single candle, buyers pushed price way higher. Yes, sellers fought back. Yes, price closed low. But the damage is done. The buyers proved something important. They proved that sellers can no longer keep price pinned to the floor.
The long upper wick is not a failure. It is a test of higher prices. It is like a scout reporting back: “Higher prices are possible. The enemy is weaker than they look.”
Why is inverted hammer bullish? Because demand is waking up. Supply is still there, but it is no longer overwhelming. That tiny shift in power is the seed of a reversal. You just need one more candle to confirm that the seed is growing.
The Takeaway
The psychology of inverted hammer comes down to one simple idea. A losing battle can still be a winning signal. The candle closed low, but the fact that price went high at all is the real story. Listen to that story. Wait for confirmation. Then act.
How to Identify the Inverted Hammer (Rules & Criteria)
How to Identify
the Inverted Hammer
Not every candle with a long upper wick is an inverted hammer. You need to follow specific rules. Otherwise, you will trade false signals and lose money. Let me give you a simple checklist. If any rule is missing, do not call it an inverted hammer formation.
The 5 Golden Rules
Rule 1: A prior downtrend is essential.
This is non negotiable. The inverted hammer rules start with context. You need a clear downtrend before the candle appears. Think of it like this. A fire extinguisher is useless if there is no fire. The inverted hammer is a reversal pattern. It cannot reverse something that is not there. Look back at least 10 to 15 candles. Price should be making lower lows and lower highs. No downtrend? Then it is not an inverted hammer.
Rule 2: Long upper wick. At least 2 to 3 times the body length.
Measure it. The upper wick should be significantly longer than the real body. If the body and wick are the same size, keep looking. That is a different pattern. The whole point of how to identify inverted hammer is spotting that long skinny wick reaching up like a question mark.
Rule 3: Small real body at the lower end of the trading range.
The body (the thick part) must sit near the bottom of the candle. Not in the middle. Not at the top. At the bottom. Imagine a tiny boat floating near the floor of a canyon. That is your body. The upper wick is the canyon walls reaching up.
Rule 4: Little to no lower wick.
This is a common mistake. Beginners see any hammer shape and get excited. But an inverted hammer barely has a lower wick. The low of the candle and the bottom of the body are almost the same price. If you see a long lower wick, you are looking at a different candle. Possibly a spinning top or a doji.
Rule 5: Confirmation on the next candle.
This is the most important part of inverted hammer formation. Do not trade the inverted hammer alone. Wait for the next candle to close above the hammer’s high or at least above its body. Why? Because the hammer only shows a potential reversal. Confirmation proves that buyers actually showed up the next day. No confirmation? No trade. Simple as that.
The Role of Volume: High vs Low
Volume is your lie detector. It tells you if the story inside the candle is real or fake.
| Volume Level | What It Means | What You Should Do |
|---|---|---|
| Inverted hammer with high volume | Strong confirmation. Lots of traders participated in that buying spike. Institutions or smart money were active. | This is a green light. You can trade this with more confidence after confirmation. |
| Inverted hammer with low volume | Weak signal. Few traders were involved. The spike up might have been a fluke or a single small player. | Stay cautious. Wait for stronger confirmation. Better yet, skip the trade and look for a cleaner setup. |
An inverted hammer with high volume is like a loud scream. Everyone saw it. Everyone participated. That is real buying pressure. An inverted hammer with low volume is like a whisper. Maybe something happened. Maybe not. Do not bet your money on whispers.
Quick Checklist Before You Trade
Print this in your head. Run through it every time you see a potential inverted hammer.
- Is there a clear downtrend before this candle?
- Is the upper wick at least 2 to 3 times the body?
- Is the small body sitting at the bottom of the range?
- Is there little to no lower wick?
- Has the next candle confirmed above the hammer’s high or body?
- Is volume high or at least above average?
If you check all these boxes, you have correctly learned how to identify inverted hammer. Now you are ready to think about trading it.
Where Does the Inverted Hammer Appear? (Location Matters)
Here is a truth that will save you a lot of money. The exact same candle means two completely different things depending on where it shows up. Location is everything. You cannot just look at the shape. You have to look at the neighborhood.
Let me break down the four possible locations and what each one means.
Location 1: At the Bottom of a Downtrend (The Holy Grail)
This is the primary and most reliable use of the pattern. You see an inverted hammer at bottom of a long downtrend. Price has been falling for a while. Sellers are exhausted. Then this little candle appears with its long upper wick.
What does it mean? Buyers are testing the waters. They are saying “maybe we go higher soon.” This is a valid bullish reversal signal. This is where the inverted hammer at bottom of downtrend becomes your friend. It is not a guarantee, but it is a strong warning that the selling pressure is ending.
Verdict: Bullish. Look for confirmation and consider a long trade.
Location 2: At Support (Even Within a Larger Trend)
Support is a price level where buyers have stepped in before. Think of it like a floor. Price keeps bouncing up from that level. Now imagine you see an inverted hammer at support. Even if the overall trend is sideways or mixed, this is still a bullish signal.
Why does it work? Because support already tells you that buyers like that price. The inverted hammer adds extra evidence. It says “buyers tried to push up from this level and almost succeeded.” Combine the two, and you have a high probability setup.
Verdict: Bullish, especially if volume confirms the hammer.
Location 3: At the Top of an Uptrend (Danger Zone)
Pay close attention here. This is where beginners get burned. If you see this candle at the top of an uptrend, it is NOT an inverted hammer. It has a different name. It is called a Shooting Star. And it is bearish.
Let me explain the danger. Price has been going up for a while. Everyone is excited. Then a candle forms with a long upper wick and a small body at the bottom. What happened? Buyers tried to push even higher. They failed. Sellers pulled price back down. That is a warning that the uptrend might be ending.
If you see an inverted hammer at top and you call it a bullish signal, you will lose money. Plain and simple. The correct name is Shooting Star. The correct signal is bearish reversal.
Verdict: Bearish. Do not confuse it with an inverted hammer. Remember: downtrend = inverted hammer (bullish). Uptrend = Shooting Star (bearish).
Location 4: At Resistance (Failed Breakout)
Resistance is a ceiling. It is a price level where sellers have stopped buyers before. Now imagine you see this candle right at that ceiling. Price tries to break through resistance. It shoots up (long upper wick). Then it falls back down and closes near the bottom. That is an inverted hammer at resistance.
What does this mean? It means the breakout attempt failed. Buyers tried to push through the ceiling. Sellers said “no way” and slammed price back down. This is actually a bearish signal. It tells you that resistance is holding strong.
Verdict: Bearish. Do not buy here. If you are already in a long position, consider taking profits. Some traders even take a short position after confirmation.
Quick Reference Table
| Location | Correct Name | Signal | Action |
|---|---|---|---|
| Bottom of downtrend | Inverted Hammer | Bullish reversal | Look to buy |
| At support level | Inverted Hammer | Bullish reversal | Look to buy |
| Top of uptrend | Shooting Star | Bearish reversal | Look to sell |
| At resistance | Shooting Star (or failed breakout) | Bearish | Avoid buying, consider selling |
The Bottom Line
Do not fall in love with the shape alone. The inverted hammer at bottom is your friend. The inverted hammer at bottom of downtrend or inverted hammer at support gives you a bullish edge. But the exact same candle at top or at resistance will wreck your account if you treat it as bullish.
Learn the difference. Check the location first. Then trade.
Inverted Hammer vs. Similar Candlesticks (Comparison)
Here is where things get tricky. The inverted hammer has several cousins that look almost identical. Mixing them up is one of the fastest ways to lose money. Let me help you tell them apart once and for all.
Below is a complete comparison table. Study it. Bookmark it. Come back to it whenever you are unsure.
The Ultimate Comparison Table
| Pattern | Location | Trend | Wick | Body | Signal |
|---|---|---|---|---|---|
| Inverted Hammer | Bottom | Downtrend | Upper (long) | Bottom | Bullish Reversal |
| Shooting Star | Top | Uptrend | Upper (long) | Bottom | Bearish Reversal |
| Hammer | Bottom | Downtrend | Lower (long) | Top | Bullish Reversal |
| Hanging Man | Top | Uptrend | Lower (long) | Top | Bearish Reversal |
| Gravestone Doji | Top/Bottom | Either | Upper (long) | Open = Close | Weak reversal |
| Pin Bar | Any | Either | Either end | Small body | General rejection |
Now let me break down the most important comparisons so you never confuse them again.
Inverted Hammer vs Shooting Star
This is the most common confusion. The difference between shooting star and inverted hammer is not in the shape. It is in the location. Both candles look identical. Long upper wick. Small body at the bottom. Same face. Different names.
The inverted hammer appears at the bottom of a downtrend. It is bullish. The Shooting Star appears at the top of an uptrend. It is bearish.
Think of it like a stop sign. The sign does not change shape. But a stop sign at a crosswalk means something different than a stop sign on a highway. Same object. Different context. Different meaning. That is the inverted hammer vs shooting star rule.
| Inverted Hammer | Shooting Star | |
|---|---|---|
| Where? | Bottom of downtrend | Top of uptrend |
| What does it mean? | Bullish reversal | Bearish reversal |
| What do you do? | Look to buy | Look to sell |
Inverted Hammer vs Hammer
Beginners mix these up all the time because the names sound similar. But they are completely different shapes. The difference between hammer and inverted hammer comes down to which end has the long wick.
An inverted hammer has a long upper wick. The body sits at the bottom. It looks like an upside down T.
A hammer has a long lower wick. The body sits at the top. It looks like a capital T or a lollipop.
Both appear at the bottom of downtrends. Both are bullish reversal signals. Same location. Same signal. Opposite shapes.
| Inverted Hammer | Hammer | |
|---|---|---|
| Wick location | Upper (long) | Lower (long) |
| Body location | Bottom | Top |
| Visual | Upside down T | Right side up T |
| Signal | Bullish reversal | Bullish reversal |
Inverted Hammer vs Hanging Man
The inverted hammer vs hanging man comparison is easy once you remember one rule. The hanging man is just a hammer that appears in the wrong place.
A hanging man has the exact same shape as a hammer. Long lower wick. Small body at the top. But it appears at the top of an uptrend instead of the bottom. That makes it a bearish reversal signal.
So if you see a hammer shape at the bottom, it is a hammer (bullish). If you see that exact same shape at the top, it is a hanging man (bearish). Location changes everything.
| Inverted Hammer | Hanging Man | |
|---|---|---|
| Shape | Long upper wick | Long lower wick |
| Location | Bottom of downtrend | Top of uptrend |
| Signal | Bullish reversal | Bearish reversal |
Inverted Hammer vs Gravestone Doji
The inverted hammer vs gravestone doji comparison is subtle but important. Both have long upper wicks. But there is one critical difference.
A gravestone doji has the open, close, and low all at the same price. The real body disappears completely. It looks like an upside down T with no thick part. The inverted hammer still has a small visible body at the bottom.
Also, a gravestone doji can appear at the top OR bottom of a trend. Its signal is weaker than an inverted hammer. It suggests indecision more than a strong reversal.
| Inverted Hammer | Gravestone Doji | |
|---|---|---|
| Real body | Small but visible | Open equals close (no body) |
| Location | Bottom of downtrend | Top or bottom |
| Signal | Bullish reversal | Weak reversal or indecision |
Inverted Hammer vs Pin Bar
The inverted hammer vs pin bar comparison is for traders who use price action strategies. A pin bar is a broader category. It has a long wick on one end, a small body, and little to no wick on the other end.
An inverted hammer is actually a specific type of pin bar. It is a pin bar with a long upper wick that appears at the bottom of a downtrend. But pin bars can show up anywhere. They can have long lower wicks instead. They can signal rejection of a price level without a full reversal.
| Inverted Hammer | Pin Bar | |
|---|---|---|
| Category | Specific pattern | General pattern |
| Wick | Always upper | Upper or lower |
| Location | Bottom of downtrend | Anywhere |
| Signal | Bullish reversal | Rejection (context dependent) |
Quick Memory Tricks
Here are some easy ways to keep them straight.
- Inverted Hammer = Upside down hammer. Long wick up. Bottom of downtrend. Bullish.
- Shooting Star = Same shape as inverted hammer but at the top. Bearish.
- Hammer = Right side up. Long wick down. Bottom of downtrend. Bullish.
- Hanging Man = Same shape as hammer but at the top. Bearish.
- Gravestone Doji = Like an inverted hammer but with no body. Weaker signal.
- Pin Bar = The big family. Inverted hammer is one member.
Memorize these differences. Your trading account will thank you.
How to Trade the Inverted Hammer (Strategy Guide)
Knowing how to spot an inverted hammer is one thing. Knowing how to trade it is another. This section will walk you through exactly where to enter, where to place your stop loss, and where to take profits. No vague advice. Just a clear inverted hammer trading strategy you can use right away.
First, let me answer the most common question beginners ask.
Inverted Hammer Buy or Sell?
The answer is BUY. But with one very important condition. You only buy after confirmation. Never buy at the close of the inverted hammer itself without seeing what happens next. The pattern tells you a reversal might happen. Confirmation tells you it is actually happening.
So remember this rule. Inverted hammer buy or sell? Buy, but only after the next candle confirms.
What Happens After an Inverted Hammer?
Before you place a trade, you should know what to expect. So what happens after inverted hammer in most cases?
Typically, price will do one of two things. First, it might move higher immediately. The next candle breaks the high of the hammer’s wick, and buyers take over. Second, price might consolidate sideways for a few candles, then move higher. The consolidation is normal. It is just the market catching its breath before the upward move.
Rarely, the pattern fails. Price breaks below the hammer’s low. That is your signal to get out and wait for a better setup.
Step By Step Trading Strategy
Let me give you a complete how to trade inverted hammer candlestick plan. Follow these steps in order.
Step 1: Identify a Valid Setup
Run through your checklist from the previous section.
- Clear downtrend before the hammer?
- Long upper wick (2 to 3 times the body)?
- Small body at the bottom?
- Little to no lower wick?
- Volume at least average or higher?
If yes, you have a candidate. If no, walk away.
Step 2: Choose Your Entry Point
You have two options here. One is aggressive. One is conservative.
Aggressive Entry (Higher risk, higher reward)
Enter at the close of the inverted hammer candle. You are betting that the reversal starts immediately. This gets you in early, but you have no confirmation yet. Only use this if volume was very high and the downtrend was extremely oversold.
Conservative Entry (Lower risk, more reliable)
Wait for the next candle to break the high of the inverted hammer’s upper wick. Once price moves above that level, you have confirmation. Buyers have returned. The reversal is underway.
This is the inverted hammer entry point most professional traders prefer. It gives you fewer trades but more winners.
| Entry Type | When to Enter | Risk Level | Recommended For |
|---|---|---|---|
| Aggressive | Close of hammer candle | Higher | Experienced traders |
| Conservative | Break of hammer’s high | Lower | Beginners and most traders |
Step 3: Set Your Stop Loss
Your inverted hammer stop loss goes just below the low of the hammer candle. Why? Because if price breaks below that low, the pattern has failed. Sellers have taken back control. You do not want to be in the trade anymore.
Here is the exact rule. Place your stop loss 1 to 2 ticks (or a few pips) below the lowest point of the inverted hammer. That includes the lower wick if there is one, or the body if there is no lower wick.
Step 4: Set Your Take Profit Targets
You need at least two profit targets. The first is your conservative target. The second is your aggressive target.
Target 1: Recent swing high
Look left on your chart. Find the most recent high before the downtrend started. That is your first take profit level. Price often pauses or pulls back at this level.
Target 2: Fibonacci 61.8% retracement
Draw a Fibonacci retracement from the start of the downtrend to the bottom of the inverted hammer. The 61.8% level is a powerful magnet for price. Many reversals reach this level before continuing or reversing again.
Step 5: Respect the Risk Reward Ratio
Here is how to check it before you enter.
- Calculate your risk. Entry price minus stop loss price.
- Calculate your reward. First target price minus entry price.
- Divide reward by risk. If the number is less than 2, do not take the trade.
| Risk (Stop Loss Distance) | Reward (Target Distance) | Ratio | Do You Take the Trade? |
|---|---|---|---|
| $1.00 | $2.00 | 1:2 | Yes |
| $1.00 | $3.00 | 1:3 | Yes (even better) |
| $1.00 | $1.50 | 1:1.5 | No. Walk away. |
Complete Trade Example
Here is a real example so you can see how the entire Inverted Hammer setup works in practice.
The Setup
Stock ABC drops from $100 to $80 over a two-week period, showing clear bearish momentum. Near the $80 support area, an Inverted Hammer appears with a long upper wick and strong trading volume.
- Hammer low: $79.50
- Hammer high: $82.00
This suggests buyers are starting to push back against sellers.
The Trade Plan
Entry (Conservative):
Buy only after price breaks above $82.00 for confirmation.
Stop Loss:
Place the stop below the hammer low at $79.00.
Risk Calculation:
- Entry: $82.00
- Stop Loss: $79.00
- Total risk: $3.00 per share
Target 1:
Recent swing high at $90.00
- Potential reward: $8.00
- Risk-to-reward ratio: 1:2.6
Target 2:
Fibonacci 61.8% retracement at $92.50
- Potential reward: $10.50
- Risk-to-reward ratio: 1:3.5
The Outcome
The next day, price breaks above $82.00 and confirms the reversal. The trade moves higher and reaches $90.00, where part of the position is closed to secure profits. Momentum continues, and price later reaches $92.50, where the remaining position is exited.
The trade is complete with profits locked in and risk managed from the beginning.
Common Mistakes to Avoid
Here are three quick traps that snag beginners learning how to trade inverted hammer.
Mistake 1: Trading without confirmation. Never enter at the hammer’s close unless you are very experienced. Wait for the break above the high.
Mistake 2: Placing the stop loss too tight. Putting your stop inside the hammer’s range will get you stopped out by normal volatility. Put it below the low.
Mistake 3: Ignoring the risk reward ratio. Even a great setup is a bad trade if the reward is too small. Be patient. Wait for setups with 1 to 2 or better.
Summary of the Inverted Hammer Trading Strategy
| Element | What to Do |
|---|---|
| Action | BUY after confirmation |
| Aggressive Entry | Close of the hammer candle |
| Conservative Entry | Break of the hammer’s upper wick high |
| Stop Loss | Just below the hammer’s low |
| First Target | Recent swing high |
| Second Target | Fibonacci 61.8% retracement |
| Minimum Risk Reward | 1 to 2 |
| What happens after? | Move higher or sideways then higher |
Now you have a complete inverted hammer trading strategy. Practice on historical charts first. Then trade it live with small size. Once you get comfortable, scale up.
Double Inverted Hammer & Other Variations
Most of the time, you will see a single inverted hammer candle. But sometimes the market gives you something extra. Two inverted hammers in a row. Back to back. That is called a double inverted hammer, and it is a powerful signal worth understanding.
Let me also clear up some naming questions. There are a few another name for inverted hammer options floating around out there. I will explain what is correct and what is just trader slang.
Double Inverted Hammer: Two Consecutive Signals
Imagine this. You are in a downtrend. Price has been falling for days. Then the first inverted hammer appears. Long upper wick. Small body at the bottom. You get interested. But you wait for confirmation.
The next day, another inverted hammer forms. Same shape. Long upper wick. Small body at the bottom. That is a double inverted hammer. Two candles in a row with the exact same story.
What does it mean?
The first hammer said “buyers tried to push up.” The second hammer says “buyers tried again and sellers still cannot take full control.” This is a repeated failure of sellers to push lower. Each failed attempt weakens the bears more.
Think of it like a door. Someone kicks it once. It does not open. They kick it again. Still does not open. But the door is cracking. The third kick might break through. A double inverted hammer is like two kicks. The reversal is likely coming soon.
How to trade a double inverted hammer
The rules are almost the same as a single hammer. But you have even stronger evidence.
- Entry: Wait for the next candle to break above the highs of both hammers. Use the higher of the two highs as your trigger.
- Stop Loss: Place your stop just below the lowest low of the two hammers.
- Confidence level: Higher than a single hammer. You can size your position a bit larger if everything else looks good.
Real example of two inverted hammer in a row
| Day | Candle | What It Tells You |
|---|---|---|
| Day 1 | Inverted hammer | Buyers tested higher prices. Sellers fought back but could not win. |
| Day 2 | Another inverted hammer | Buyers tested again. Sellers are still weak. The downtrend is dying. |
| Day 3 | Big green candle | Confirmation. Price breaks above both hammer highs. Reversal begins. |
That is the power of two inverted hammer in a row. It is not common, but when it happens, pay close attention.
Another Name for Inverted Hammer
You might hear traders use different names for this pattern. Let me clear up the confusion.
The standard and most widely accepted name is inverted hammer. That is what you will see in most trading books, courses, and charting software. Stick with this name to avoid confusion.
However, some traders call it a reverse hammer. Same pattern. Same meaning. Just a different word. “Reverse” makes sense because the pattern is like a regular hammer flipped upside down.
You might also hear bullish inverted hammer. This name emphasizes the signal rather than the shape. It tells you right away that this version is bullish (unlike the shooting star, which is bearish).
Here is the bottom line on another name for inverted hammer.
| Name | Is It Correct? | When to Use It |
|---|---|---|
| Inverted Hammer | Yes (standard) | Always. This is the professional term. |
| Reverse Hammer | Yes (slang) | Acceptable but less common. |
| Bullish Inverted Hammer | Yes (descriptive) | Useful when comparing to a shooting star. |
Just know that “inverted hammer” is the gold standard. If you use that name, every trader will understand you.
Summary: Variations at a Glance
- Single inverted hammer: Standard bullish reversal signal. Needs confirmation.
- Double inverted hammer: Two in a row. Stronger signal. Shows repeated seller failure.
- Reverse hammer: Another name for the same pattern. Less common.
- Bullish inverted hammer: Descriptive name that emphasizes the signal direction.
Now you know how to spot the standard version, recognize the stronger double version, and understand the different names people use. Keep practicing, and these variations will jump off the chart at you.
CONCLUSION
Let me bring it all together for you. The inverted hammer reversal is one of the most reliable bullish signals you can find at the bottom of a downtrend. That long upper wick tells a simple story. Buyers tested higher prices. Sellers could not keep them pinned down. The psychology of failed selling is powerful, and this chart pattern inverted hammer captures it perfectly.
But here is what you need to remember. No pattern works every time. Always wait for confirmation on the next candle. Never trade this pattern at the top of an uptrend. That is a Shooting Star, and it will burn you. Use a stop loss below the hammer’s low. And pay attention to volume. High volume makes the signal stronger.
So what happens after inverted hammer? With confirmation, price usually moves higher or sideways before going up. Without confirmation, the downtrend can continue. Your job is to wait for that confirmation candle.
Now it is your turn. Go practice. Pull up historical charts. Find every inverted hammer reversal you can spot. Paper trade them first. Build your confidence. Then trade live with small size. You have the knowledge. Go put it to work.
FREQUENTLY ASKED QUESTIONS (FAQ)
What does an inverted hammer indicate?
It indicates a potential bullish reversal after a downtrend. It shows that buyers rejected lower prices and attempted a rally, signaling weakening selling pressure.
Is inverted hammer bullish or bearish?
It is bullish when found at the bottom of a downtrend or at support. If found at the top of an uptrend, it is called a Shooting Star, which is bearish.
What is the difference between a shooting star and an inverted hammer?
Same shape, different location. The inverted hammer appears at the bottom of a downtrend and is bullish. The Shooting Star appears at the top of an uptrend and is bearish.
What is the difference between a hammer and an inverted hammer?
A hammer has a long lower wick and a small body at the top. It looks like a capital T. An inverted hammer has a long upper wick and a small body at the bottom. It looks like an upside down T.
What happens after an inverted hammer?
After a valid inverted hammer with confirmation, price usually moves higher or consolidates sideways before continuing the new uptrend. If no confirmation appears on the next candle, the downtrend may continue.
How to trade an inverted hammer candlestick?
Enter after confirmation when the next candle closes above the high of the upper wick. Place a stop loss just below the low of the hammer. Target previous swing highs or use a minimum 1 to 2 risk to reward ratio.
Does the color of the inverted hammer matter (green vs red)?
Not significantly. A green inverted hammer with a bullish close is slightly stronger. But a red inverted hammer with a bearish close still acts as a valid reversal signal as long as the upper wick is long and the location is correct.
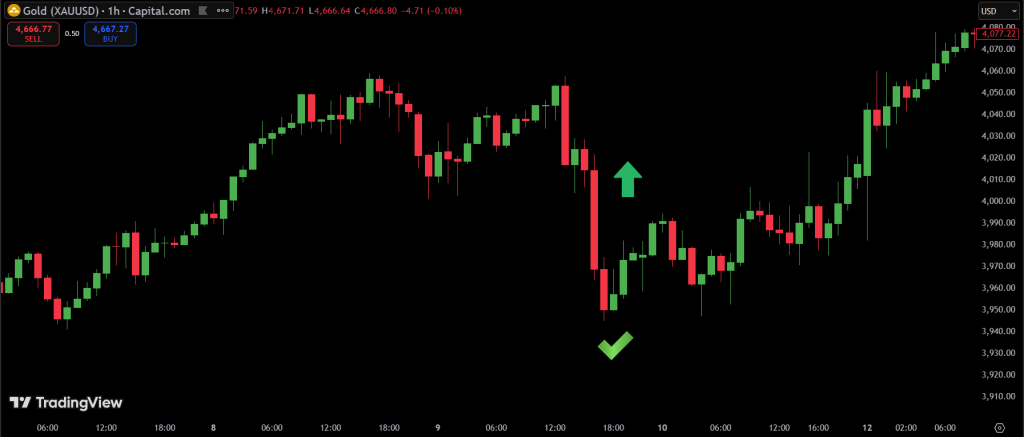
Can I trade an inverted hammer on lower timeframes like the 1 hour chart?
Yes, but it is less reliable than daily or weekly charts. On a 1 hour inverted hammer, always look for higher than average volume and confluence with support or resistance levels.

