Shooting Star
Pattern Setup
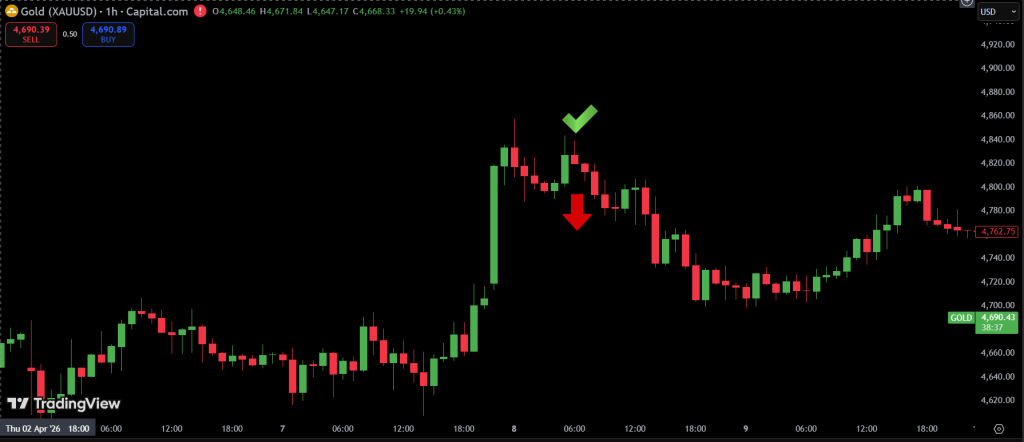
Have you ever watched a stock rip higher only to watch it crumble right before the close? If so, you have already seen the shooting star pattern in action. This single candlestick looks exactly how it sounds. It is a brilliant rally that fizzles out, leaving behind a long upper wick and a tiny real body near the bottom. Make no mistake: the market just sent a warning flare. The shooting star candlestick pattern meaning boils down to one simple idea. Buyers tried to push prices to the moon, but sellers slammed the door shut by the end of the session.
So what is the game plan from here? This guide walks through everything from spotting the pattern in real time to pulling the trigger on a trade. Readers will learn the key rules for recognition, how to wait for confirmation instead of jumping the gun, where to place entries and stop losses, realistic profit targets, and the actual probability of a successful reversal. No fluff, no guesswork. Just a clean breakdown of how to trade this bearish signal like a pro.
What Is the Shooting Star Pattern? (Anatomy & Formation)
Let us break down exactly what you are looking at on a price chart. The answer is simpler than you might think. A shooting star is a single candlestick that appears after a clear uptrend. So what is shooting star pattern? It is a candle with a long upper wick (or shadow), a small real body near the bottom of the candle’s range, and little to no lower wick. The upper wick should be at least two times the length of the real body. That is the golden rule. The real body itself can be red or green, but a red body gives a stronger bearish signal because it means sellers controlled the close and pushed price down from the highs.
Now think of this pattern as a failed breakout. Imagine price shooting higher during the session. Buyers get excited and jump in. They push the market up to fresh highs. But then something changes. Sellers appear out of nowhere and start hammering price back down. By the time the session ends, the candle has a long wick on top and a tiny body near the bottom. That long upper wick tells the whole story. It is a rejection of higher prices. That is the shooting star pattern in a nutshell. The market tried to go up, but sellers said “not so fast.”
The shooting star price pattern is easy to spot once you know what to look for. You just need an uptrend, a long upper wick, and a small lower body. Do not overcomplicate it. And because it is a shooting star technical pattern, it fits right into any trader’s toolbox for spotting potential market tops. Many traders combine it with support and resistance levels or oscillators like RSI to filter out weak signals. But at its core, this pattern comes down to one word: rejection. Buyers got rejected. Price got rejected. And that rejection often marks the beginning of a downtrend.
To wrap up the anatomy, remember this checklist. First, there must be a prior uptrend. Second, the upper wick is long. Third, the real body is small and sits near the bottom. Fourth, there is almost no lower wick. When all four pieces come together on your chart, you are looking at a genuine shooting star. Not a doji. Not a spinning top. A real shooting star ready to signal a bearish reversal.
What Does a Shooting Star Pattern Mean? (Market Psychology)
Let us get inside the minds of buyers and sellers during a shooting star. To understand what does a shooting star pattern mean, you have to feel the shift in emotion. The session starts with optimism. Buyers are in control from the opening bell. They push price higher and higher. FOMO kicks in. Traders who missed the move start jumping on board. The rally looks unstoppable. But then something flips. Sellers step in aggressively. They start dumping shares at those peak prices. The bid evaporates. Price gets dragged all the way back down near where it started. By the close, the bulls are scratching their heads. That is what does a shooting star pattern indicate in plain English. It indicates that the party might be over.
Now let us talk about meaning of shooting star pattern from a professional lens. This candle tells you that supply has overtaken demand. The long upper wick is proof. Every buyer who got in near the high is now sitting on a loss. Those traders become future sellers. So when shooting star pattern indicates a reversal, it is not just guesswork. It is rooted in real market behavior. The pattern works because human nature does not change. Greed drives price up. Fear drives it back down. And the shooting star captures that exact moment when greed turns into fear.
What about the color of the real body? If shooting star pattern means a red close, that is extra bearish. It means sellers not only rejected the high but also pushed price lower than where it opened. They meant business. A green close is still a valid shooting star, but it shows buyers held on a little longer. Either way, the key is the long upper wick. That wick is the smoking gun. It shows failure. And when you see that failure at the top of an uptrend, you should pay attention. Many beginner traders ignore this pattern. Professionals know better.
So what does shooting star pattern mean for your next trade? It means you should stop looking for buying opportunities and start watching for a short sale. It does not guarantee a crash. But it does guarantee that sellers have shown up to the fight. And in the stock market, that is often the first step in a trend change.
Is Shooting Star a Reversal Pattern? (Bearish Confirmation Context)
Let us answer the big question right up front. Yes, the shooting star is absolutely a bearish reversal pattern. But there is a catch. It is a warning, not a guarantee. So when someone asks is shooting star a reversal pattern, the honest answer is yes, but only if you treat it as a signal that needs backup. The candle alone does not give you permission to smash the sell button. What it does is wave a red flag. It tells you to get ready. The real trade comes after the market confirms the reversal with the next candle.
Now let us dig into shooting star reversal pattern mechanics. For this pattern to work as a true reversal signal, it must appear after a noticeable uptrend. The longer the uptrend, the more powerful the signal. A shooting star in the middle of a sideways range means very little. Context is everything. Also, the pattern works best when it forms at a known resistance level or a round number like 50or100. Why? Because those are places where sellers naturally show up. Combine a shooting star with resistance, and you have a much stronger shooting star bearish reversal pattern than one floating in empty space.
What about false signals? They happen all the time. A shooting star can appear, and price can keep ripping higher the next day. That is why you never trade the shooting star candle itself. You wait for confirmation. Confirmation means the next candle closes below the low of the shooting star. Until then, the bulls are still in the game. Many traders get burned because they see the long upper wick and immediately short the market. That is a rookie mistake. The pros know that is shooting star a reversal pattern is the wrong question. The right question is: “Has the market confirmed the reversal yet?”
To sum it up, the shooting star is a bearish reversal pattern by definition. But in real trading, treat it as a conditional signal. It needs three things to be highly reliable. First, a clear uptrend. Second, a location near resistance. Third, confirmation from the next candle. When all three line up, you are looking at one of the most dependable reversal signals in technical analysis.
What Is the Shooting Star Pattern? (Anatomy & Formation)
What Makes a
Real Shooting Star?
Let us walk through everything you need to recognize this pattern on any chart.
The Visual Anatomy of a Shooting Star
A shooting star is a single candlestick that appears after a clear uptrend. So what is shooting star pattern? It is a candle with a long upper wick (or shadow), a small real body near the bottom of the candle’s range, and little to no lower wick. The upper wick should be at least two times the length of the real body. That is the golden rule. The real body itself can be red or green, but a red body gives a stronger bearish signal because it means sellers controlled the close and pushed price down from the highs.
Why It Looks Like a Failed Rocket Launch
Think of this pattern as a failed breakout. Imagine price shooting higher during the session. Buyers get excited and jump in. They push the market up to fresh highs. But then something changes. Sellers appear out of nowhere and start hammering price back down. By the time the session ends, the candle has a long wick on top and a tiny body near the bottom. That long upper wick tells the whole story. It is a rejection of higher prices. That is the shooting star pattern in a nutshell. The market tried to go up, but sellers said “not so fast.”
Spotting the Shooting Star Price Pattern in Real Time
The shooting star price pattern is easy to spot once you know what to look for. You just need an uptrend, a long upper wick, and a small lower body. Do not overcomplicate it. And because it is a shooting star technical pattern, it fits right into any trader’s toolbox for spotting potential market tops. Many traders combine it with support and resistance levels or oscillators like RSI to filter out weak signals. But at its core, this pattern comes down to one word: rejection. Buyers got rejected. Price got rejected. And that rejection often marks the beginning of a downtrend.
The Four Part Checklist for Beginners
To wrap up the anatomy, remember this checklist. First, there must be a prior uptrend. Second, the upper wick is long. Third, the real body is small and sits near the bottom. Fourth, there is almost no lower wick. When all four pieces come together on your chart, you are looking at a genuine shooting star. Not a doji. Not a spinning top. A real shooting star ready to signal a bearish reversal.
Shooting Star Pattern Confirmation (Avoiding Fakeouts)
Here is the hard truth. A shooting star by itself is just a warning, not a trade signal. If you short the moment you see that long upper wick, you will get burned again and again. The market loves to punish impatience. So what is the solution? Confirmation. You need to wait for proof that sellers are actually in control. That means letting the next candle print before you pull the trigger. The shooting star pattern confirmation is what separates beginners from consistent traders.
So what does real confirmation look like? The most reliable signal is the next candle closing below the low of the shooting star. That is the line in the sand. When price breaks that low and stays there, the bears have won. At that moment, how to trade a shooting star pattern becomes clear. You enter a short position. You place your stop loss above the shooting star’s high. And you let the trade breathe. Without that breakdown, you sit on your hands. No trade. No exceptions.
Now let us talk about trading shooting star pattern with extra filters. Volume is your best friend. A shooting star on high volume is much more powerful than one on low volume. Why? Because high volume means big players are involved. Institutions are selling. That is not noise. That is real money moving. Also, look for RSI divergence. If price made a higher high but RSI made a lower high, and then a shooting star appears, you have a triple confirmation. That is gold.
The shooting star pattern technical analysis approach requires patience. Wait for the close below the low. Check the volume. Look for divergence. When all three line up, the trade has a high probability of success. But if you jump in early, the market will humble you fast. One more thing. The shooting star pattern price action works best when the shooting star itself is clean. Long upper wick. Small body. No lower wick. Do not try to force confirmation on ugly candles. Wait for a beautiful shooting star, then wait for confirmation. That is the professional way.
Shooting Star Pattern Entry, Stop Loss & Target (Trading Strategy)
How Traders Enter,
Exit & Manage
Risk
Let us get down to the actual mechanics of pulling the trigger. You have spotted a beautiful shooting star at resistance. You have waited for confirmation. Now what? This is where most traders overcomplicate things. Do not let that be you. The shooting star pattern entry is straightforward. You enter a short position when the next candle closes below the low of the shooting star. Some traders use a sell stop order right at that low level. Others wait for the candle to finish. Either way, the rule is the same. Do not enter before the break. Let the market show its hand first.
Now where do you get out if you are wrong? That is your stop loss. Place it just above the high of the shooting star’s upper wick. Give the trade a little room. If price rallies back above that high, the pattern has failed. You take your small loss and move on to the next setup. The beauty of this approach is that your risk is clearly defined from the moment you enter. No guessing. No second thoughts. That is professional risk management.
What about the upside? Let us talk shooting star pattern target. The simplest method is a 1 to 1 risk to reward ratio. If you risk one dollar per share, your first target is one dollar down. Take some profit off the table there. Then let the rest ride. For your second target, look for the next major support level on the chart. That could be a previous low, a moving average, or a round number. Often that second target gives you a 2 to 1 or even 3 to 1 reward on your risk. Not bad for a single candle pattern.
So what are the odds of success? The shooting star pattern probability improves dramatically with confirmation. Without confirmation, you are below 50 percent. Basically a coin flip. With confirmation on a daily chart, the success rate climbs to around 60 to 70 percent. Add high volume and RSI divergence, and you are pushing 75 to 80 percent. On weekly charts, the success rate is even higher. On low timeframes like five minutes, it drops below 40 percent. But here is the reality check. No pattern works every time. Even the best shooting star will fail now and then. That is why you use stop losses. That is why you risk only a small percentage of your account on any single trade. The goal is not to be right every time. The goal is to let your winners run and cut your losers short.
Shooting Star Pattern Probability & Success Rate
Let us talk numbers. Trading is a game of probabilities, not certainties. The shooting star pattern is no exception. Knowing the statistical edge of this pattern helps you decide which trades to take and which to skip. Here is what the data says across different timeframes and market conditions.
The Probability Breakdown:
- Shooting star without confirmation: Success rate below 50 percent. Basically a coin flip. Not worth trading alone.
- Shooting star with next candle confirmation: Success rate between 60 and 70 percent. This is the baseline for most daily chart setups.
- Shooting star + high volume + RSI divergence: Success rate climbs to 75 to 80 percent. This is the sweet spot for experienced traders.
- Shooting star on weekly chart: Higher success rate than daily. Fewer signals but more reliable reversals.
- Shooting star on 5 minute chart during news: Success rate drops below 40 percent. Avoid unless you have other strong confirmation.
- Shooting star at major resistance level: Adds roughly 10 to 15 percent to your probability. Always check what is left of the candle before trading.
How to Scan for Shooting Star Pattern (Scanner Setup)
You cannot sit and stare at 5,000 charts all day. Nobody has time for that. That is where scanners come in. A good scanner does the heavy lifting for you. It finds potential shooting stars in seconds. Then you just review the ones that pass the filter. The shooting star candlestick pattern scanner is a tool every serious trader should have in their arsenal.
So what do you program into your scanner? Here is a simple setup that works on TradingView, Thinkorswim, Finviz, or any decent platform. First, look for an uptrend. You can scan for price above its 20 period moving average and the last three to five candles closing higher. Second, look for a long upper wick. Set the upper wick to be at least two times the length of the real body. Third, look for a small lower wick. Set it to less than 10 percent of the total candle range. Fourth, make sure the candle is near a recent high or resistance level. That last filter is optional but highly recommended.
Here is a bonus tip. Scan at the end of the trading day. Do not run the scanner in the middle of the session when candles are still forming. A candle that looks like a shooting star at 1 PM can turn into something completely different by the close. Wait for the candle to finish. Then run your scan. Mark the candidates. Check each one manually for context. Then wait for confirmation the next day. That workflow is simple, repeatable, and effective.
CONCLUSION
Let us bring it all together. The shooting star pattern is one of the most reliable bearish reversal signals in technical analysis, but only when you treat it with respect. It is not a magic bullet. It is not a buy or sell button. It is a warning light on your dashboard. When you see that long upper wick after a strong uptrend, something has changed. Buyers lost control. Sellers stepped in. The question is whether you are paying attention.
Here are the key takeaways. First, always demand a clear uptrend before even looking for a shooting star. Second, wait for confirmation. Never trade the shooting star candle itself. Let the next candle close below its low. Third, manage your risk. Place your stop loss above the upper wick high. Take profits at logical support levels. Fourth, understand the probabilities. With confirmation, you are looking at a 60 to 70 percent success rate. Add volume and RSI divergence, and that number climbs higher.
The best advice is simple. Practice on historical charts before putting real money on the line. Go back through months of price action. Find every shooting star you can. Mark whether it worked or failed. Train your eye to spot the difference between a high probability setup and a trap. Combine the pattern with other tools like volume, RSI, and support and resistance. And remember, no single pattern should ever run your entire trading plan. The shooting star is a piece of the puzzle, not the whole picture. Use it wisely, and it will serve you well.
FAQ
What is shooting star pattern?
A single-candlestick bearish reversal pattern that forms after an uptrend, characterized by a long upper wick and small real body near the low.
What does shooting star pattern mean?
It means buyers pushed price higher but sellers rejected it, closing near the low. That signals a potential trend reversal from up to down.
What does a shooting star pattern indicate?
It indicates weakening bullish momentum and increasing selling pressure. This pattern often appears at resistance levels.
Is shooting star a reversal pattern?
Yes, it is considered a bearish reversal pattern, but it requires confirmation from the next candle. Never trade it alone.
What is shooting star candlestick pattern?
A candlestick with a long upper shadow, a short lower shadow, and a small real body at the bottom of the candle’s range, occurring after an advance.
How to trade a shooting star pattern?
Wait for confirmation. That means the next candle closes below the shooting star’s low. Then enter short with a stop loss above the wick high. Target the next support level.

