If you have ever opened a price chart and felt like you were trying to read a foreign language, you are not alone. For a beginner, all those flashing candles and wiggly lines can look like pure chaos. Understanding the trading indicators meaning is the first step to clearing that fog. A trading indicator is simply a mathematical calculation plotted onto your chart as a line, a histogram, or a dot. Think of it as a calculator for market conditions. Instead of guessing whether a price is too high or too low, an indicator crunches the numbers and shows you a visual result.
Now, what can you actually do with these tools? They help you measure momentum, volatility, and trend strength without having to memorize complex formulas. To answer the question of what are trading indicators in plain English: they are like a second pair of eyes on your screen. They do not predict the future, but they do tell you what the market is doing right now. Once you learn to read a few basic signals, you stop gambling and start trading with a real plan.
The Basics: More Than Just Lines on a Chart
Let us get one thing straight right off the bat. A Forex indicators definition is not some magical crystal ball. In the world of currency trading, an indicator is simply a tool that takes raw price data (like open, close, high, and low) and runs it through a formula. The result is a visual representation on a chart. Some people call them technical analysis tools, and that is exactly what they are. Traders use math to analyze art. That is the beauty of it.
So what do these things actually look like in action? Most people have seen screenshots with squiggly lines running through price bars or a separate window below the chart with colored bars bouncing up and down. Those are indicators. They serve as chart tools to examine price, time, and participation. Price tells how much an asset costs. Time tells when something happened. Participation (often called volume or momentum) tells how many traders are jumping on board. When all three are combined, the real story behind the numbers starts to appear.
What is trading indicator in practical terms? Think of a speedometer in a car. The speedometer does not tell the driver where to go. It just tells how fast the vehicle is moving right now. An indicator works the same way. It gives a reading of current conditions. That reading helps a trader decide whether to hit the gas or hit the brakes. Without it, trading is like driving blindfolded.
Now, a beginner might be asking, what is indicators in trading exactly? Are they all the same? No. There are dozens of them. Some follow trends. Some measure momentum. Some track volatility. And some were designed to tell traders when the market has gone too far too fast (those are called oscillators). Each type serves a different purpose. Using the right one for the right job is what separates profitable traders from gamblers.
Let us break it down even simpler. What does indicators mean in trading? They mean context. Raw price is just a number. 1.2000 on EUR/USD tells nothing by itself. But if an indicator shows that price just bounced off a support level for the third time in an hour, now there is context. Now there is an edge. That is the whole point. A trader is not guessing anymore. They are reading the language of the market through a reliable translator.
Why do people even bother with all this math? Because trading on gut feeling alone is a fast track to an empty bank account. What are trading indicators used for covers a lot of ground. They are used to spot trends before they start. They are used to time entries and exits. They are used to manage risk by showing when a trade is going south. Some traders use them to filter out false signals. Others use them to confirm what their own eyes are already seeing. Either way, a trader adds a layer of discipline to the process.
Here is a concrete example. Imagine price going up. A trader’s gut says buy. But the indicator says the market is overbought and due for a pullback. Which one should be trusted? The smart trader trusts the indicator. Why? Because the indicator is based on math. The gut is based on excitement. Excitement loses money. Math does not have emotions. That is the hidden advantage of using these tools.
So finally, what do trading indicators do in plain language? They do three things. First, they clarify. They turn messy price action into clean signals. Second, they confirm. They back up analysis with hard data. Third, they warn. They tell traders when something looks wrong before they lose their shirt. A good indicator will not make anyone rich overnight. But it will keep a trader from doing stupid things. And in trading, avoiding stupid things is half the battle.
Before wrapping up this section, let us answer one last beginner question. What is the use of indicators in trading if they are not perfect? That is a fair point. No indicator is right 100 percent of the time. They will give false signals. They will lag. They will sometimes contradict each other. But here is the kicker. Trading is not about being right. It is about being profitable. A trader can be wrong six times out of ten and still make money if the winners are bigger than the losers. Indicators help stack the odds in the trader’s favor. That is their real use. Not certainty. Just a better chance.
How Indicators Actually Work Under the Hood
Let us pop the hood and look inside. An indicator is not magic. It is just math. Every single indicator falls into one of two big buckets. The first bucket is trend followers. The second bucket is oscillators. Knowing the difference between these two is half the battle of learning to trade.
Technical indicators definition starts with this simple truth. A technical indicator is any visual tool built from price and volume data that helps a trader see something invisible to the naked eye. Price moves up and down randomly from minute to minute. That randomness hides the real trend. An indicator smooths out that noise. It reveals the signal buried underneath.
So what is the difference between the two buckets? Trend following indicators work best when the market is moving strongly in one direction. Think of a river. When the current is strong, a boat drifts downstream without much effort. That is a trend. Oscillators work best when the market is moving sideways, bouncing between a floor and a ceiling like a tennis ball. Each tool has its own playground. Using a trend indicator in a sideways market is like wearing snow boots to the beach. It will not work well.
Let us talk about lag for a moment. This is where beginners get tripped up. Most indicators are lagging indicators. That means they look at past price to tell a story about the present. Some people see this as a weakness. They say, “Why would I want a tool that tells me what already happened?” That is a fair question. But here is the answer. A rearview mirror shows what is behind the car. No driver would ever get rid of the rearview mirror just because it looks backward. The past gives context for the future. Lag is not a bug. It is a feature.
Now, what about the time factor? Every chart has a timeframe. A one minute chart shows every single tick of price action. A daily chart shows one bar per day. An indicator behaves very differently depending on which timeframe it is applied to. A moving average that looks smooth on a four hour chart will look like a jagged mess on a one minute chart. Traders have to match the indicator to the job. Short term traders need faster, more sensitive settings. Long term traders want slower, smoother settings.
Let us clear up another common confusion. Some people think indicators cause price to move. That is backwards. Price moves first. Indicators react second. An indicator never leads the market. It always follows. Think of a dog chasing its tail. Price is the dog. The indicator is the tail. The tail does not tell the dog where to go. It just follows along. Once a trader accepts this, everything starts to make more sense.
Here is a practical example. A simple moving average takes the last 20 closing prices and averages them. That is it. Nothing fancy. When price crosses above that average line, some traders call it a buy signal. But the moving average did not create the buy signal. The moving average just reported that price had moved higher. The trader still has to decide whether that move is worth acting on. The tool provides information. The human provides judgment.
What about the risk side of things? Every indicator is a double edged sword. Too many indicators on one chart create a messy, unusable screen. That is called analysis paralysis. A beginner adds five, six, even seven indicators thinking more is better. In reality, one or two well chosen tools are plenty. The best traders keep it simple. They find one or two indicators that match their trading style and learn those inside and out. They do not chase the latest shiny tool.
Volume is another piece of the puzzle. Not all indicators use volume. But the ones that do are often more reliable. Why? Because volume tells a hidden story. Price can go up on low volume, and that rally is weak. Price can go up on high volume, and that rally has real power behind it. The best indicators combine price and volume into one number. Those are often worth a trader’s attention.
Let us talk about overbought and oversold. Those terms get thrown around a lot. Overbought means price has gone up too fast and might need to pull back. Oversold means price has dropped too fast and might need to bounce. Oscillators like RSI and Stochastics are designed specifically to measure these conditions. When RSI goes above 70, the asset is overbought. When it goes below 30, it is oversold. Simple as that. But here is the trap. In a strong uptrend, an asset can stay overbought for weeks. A beginner sees overbought and sells too early. Then they watch price keep climbing without them. That is why context matters. Overbought alone is not a sell signal. Overbought in a sideways market might be a sell signal. Overbought in a strong uptrend just means the trend is healthy.
Finally, let us address the biggest mistake new traders make. They look for the perfect indicator. The holy grail. The one tool that never loses. That tool does not exist. Every indicator will give false signals. Every indicator will have losing trades. Even the best traders in the world lose 40 or 50 percent of their trades. The difference is that their winners are bigger than their losers. An indicator is not a crystal ball. It is a tool that helps stack the odds. Nothing more. Nothing less.
Learning to use indicators takes time. There is no shortcut. But the path is straightforward. Pick one indicator. Learn what it does well. Learn what it does poorly. Trade with it on a demo account for a few weeks. Then add a second indicator to confirm signals. Keep what works. Cut what does not. That is the process.
The Most Popular Indicators and What They Actually Do
New traders often freeze up when they see the long list of available indicators. There are hundreds of them. Some have strange names like Ichimoku Kinko Hyo. Others sound like something out of a science lab, like Bollinger Bands or Average True Range. But here is the good news. A beginner only needs to know a handful. The rest are variations on the same themes.
Let us start with Moving Averages. This is the most popular family of indicators on the planet. A moving average takes a group of past closing prices and draws a single line. That line smooths out the noise. There are two main types. The Simple Moving Average treats every price equally. The Exponential Moving Average gives more weight to recent prices. Which one is better? Neither. They are just different tools for different jobs. The exponential one reacts faster. The simple one is smoother. Fast is good for catching quick moves. Smooth is good for filtering out fakeouts.
Traders use moving averages in three common ways. First, as a trend filter. If price is above the moving average, the trend is up. If price is below, the trend is down. Second, as dynamic support and resistance. In a strong trend, price often bounces off the moving average like a ball bouncing off a floor. Third, as a crossover signal. When a fast moving average crosses above a slow one, that is called a golden cross. A buy signal to some traders. When the fast crosses below the slow, that is a death cross. A sell signal.
Now let us talk about RSI, or Relative Strength Index. This little oscillator fits in a small box below the main chart. It has a single line bouncing between zero and one hundred. The magic numbers are 70 and 30. Above 70 means overbought. Below 30 means oversold. That is the basic idea. But here is where beginners mess up. They see RSI hit 70 and immediately sell short. Then price keeps going up and they get crushed. RSI can stay above 70 for a long time in a strong uptrend. The right way to use RSI is to look for divergences. A divergence happens when price makes a higher high but RSI makes a lower high. That is real warning sign. That tells a trader that momentum is fading even as price pushes higher.
MACD is next. The name stands for Moving Average Convergence Divergence. A mouthful for sure. But the tool itself is simple. It has two lines and a histogram of bars. The fast line is called the MACD line. The slow line is called the signal line. When the fast line crosses above the slow line, that is bullish. When it crosses below, that is bearish. The histogram shows the distance between the two lines. Big bars mean strong momentum. Small bars mean momentum is dying. MACD works best in trending markets. In sideways markets, it whipsaws back and forth and gives false signals.
Bollinger Bands are something else entirely. This tool draws three lines. The middle line is a simple moving average. The upper and lower bands are the same moving average plus and minus two standard deviations. Standard deviation is a fancy term for volatility. When the market is calm, the bands squeeze together. When the market gets wild, the bands blow apart like an accordion. Traders watch for price to touch the upper band or lower band. A touch of the upper band suggests the asset is extended to the upside. A touch of the lower band suggests it is extended to the downside. But again, in a strong trend, price can walk the upper band for days. Beginners who sell every time price touches the upper band get run over by the trend train.
Volume indicators deserve a mention too. On Balance Volume or OBV is a classic. It adds volume on up days and subtracts volume on down days. The result is a line that moves up and down with cumulative volume. When OBV confirms price, the move is strong. When OBV diverges from price, something is fishy. For example, price makes a new high but OBV stays flat. That tells a smart trader that the rally lacks participation. Big money is not buying. That high might fail.
The Average True Range or ATR is different from all the others. It does not help with direction at all. It only measures volatility. ATR tells a trader how many cents or pips an asset typically moves in a given timeframe. That is incredibly useful for setting stop losses. If EUR/USD typically moves 50 pips per day, setting a 10 pip stop loss is too tight. The normal noise of the market will hit that stop. ATR helps a trader set realistic stops that give the trade room to breathe.
Let us be honest about something. No trader needs all of these indicators. Using too many is a real problem. A chart with six indicators is not better than a chart with one. It is just cluttered. The best approach is to pick two or three that work well together. One trend indicator like a moving average. One momentum indicator like MACD or RSI. One volatility indicator like Bollinger Bands or ATR. That is plenty. More than that and a trader spends all day managing indicators instead of managing trades.
Another hard truth is that indicators work differently on different timeframes. A moving average crossover that works beautifully on a daily chart will produce endless false signals on a one minute chart. Short timeframes are noisy. Long timeframes are cleaner. Beginners often start on very short timeframes because they want action. They want to see results fast. That is a mistake. The shorter the timeframe, the more randomness. The more randomness, the less reliable the indicators. New traders should start on the daily chart or the four hour chart. Those timeframes have real information. The one minute chart mostly has noise.
One last point before moving on. Indicators are not trading systems. An indicator gives information. A trading system is a complete set of rules for entering, managing, and exiting trades. Many beginners make the mistake of buying a moving average crossover and calling it a system. That is not a system. That is one piece of a system. A real system also needs risk management rules, position sizing rules, and rules for when to stay out of the market altogether. Indicators are just inputs. The trader still has to do the hard work.
Common Mistakes That Blow Up Beginner Accounts
Even after learning the basics, most new traders still lose money. Not because trading indicators are broken. Because they use them the wrong way. Below are the most common mistakes that turn powerful technical indicators into money-destroying machines.
Mistake #1: Indicator Overload
A beginner discovers trading indicators and goes wild. They add moving averages, RSI, MACD, Bollinger Bands, Stochastics, Ichimoku, and a dozen more. The chart becomes a rainbow of lines. Nothing is readable. Each of these technical indicators gives different signals. Some say buy. Some say sell. The trader ends up doing nothing. The fix is simple. Pick two or three trading indicators that measure different things. One for trend. One for momentum. That is enough.
Mistake #2: Fighting the Higher Timeframe
A trader looks at a five minute chart, sees a buy signal from a Forex indicator, and enters a trade. But on the daily chart, the trend is down hard. That five minute buy signal is just a tiny bounce inside a massive downtrend. The trade gets crushed. Smart traders always start with the higher timeframe first. They use technical indicators on the daily chart to determine the overall direction. Only then do they drop down for entry signals. Ignoring the higher timeframe is a fast way to blow up an account.
Mistake #3: Forgetting That Technical Indicators Lag
All standard trading indicators use past price data. They are reactive, not predictive. A beginner sees a moving average crossover and thinks the technical indicator is predicting the future. It is not. It is reporting what already happened. A proper Forex indicators definition always includes the concept of lag. The fix is to accept lag as a fact of life. Use faster settings for shorter timeframes. Slower settings for longer timeframes. And never forget that price leads. Trading indicators follow.
Mistake #4: Using the Wrong Forex Indicator for the Market
Some trading indicators follow trends. Others measure momentum. In a strong trending market, momentum technical indicators give terrible signals. They scream overbought or oversold while price just keeps going. In a sideways market, trend following Forex indicators are useless. They whipsaw back and forth and rack up loss after loss. A trader must identify the market condition first. Then pick the right technical indicators for that condition.
Mistake #5: Chasing Perfect Settings on Trading Indicators
A beginner sees a trading indicator with a default setting of 14 periods. Someone on the internet says 21 is better. Someone else swears by 50. The beginner starts tweaking and tweaking, chasing a perfect setting that does not exist. Default settings work fine for most technical indicators. The math behind those numbers is not random. Optimized settings almost never work going forward. They work on past data because the trader peeked at the answer. In real time, optimized Forex indicators fall apart. Stick with defaults.
Mistake #6: Ignoring Volume with Technical Indicators
Not all trading indicators use volume. But the ones that do are often more reliable. Price can go up on low volume, and that rally is weak. Price can go up on high volume, and that rally has real power behind it. A trader who ignores volume is missing half the story. On Balance Volume is a simple technical indicator that adds volume on up days and subtracts it on down days. When this Forex indicator confirms price, the move is strong. When it diverges from price, something is fishy.
Mistake #7: Trading Too Short of a Timeframe with Forex Indicators
Short timeframes are noisy. Long timeframes are cleaner. Beginners often start on one minute or five minute charts because they want action. That is a mistake. The shorter the timeframe, the more randomness. The more randomness, the less reliable the trading indicators. New traders should start on the daily chart or the four hour chart. Those timeframes have real information. The one minute chart mostly has noise. Even the best technical indicators cannot fix a bad timeframe choice.
Mistake #8: Thinking Trading Indicators Are a Complete System
What do trading indicators do on their own? They provide information. Nothing more. A Forex indicator is not a trading system. A trading system has entry rules, exit rules, stop loss rules, position sizing rules, and rules for staying out. Many beginners buy a moving average crossover and call it a system. That is a mistake. Build a real system first. Then add technical indicators as inputs. The indicator is just one piece of the puzzle.
Mistake #9: Changing Trading Indicators After Every Loss
A trader takes three losing trades in a row. The first reaction is to blame the trading indicator. They delete it and find a new one. Then lose again. Then delete that one. The cycle never ends. The problem is rarely the technical indicator. The problem is either the market condition or the trader’s execution. Losing streaks are normal. Even the best Forex indicators lose 40 or 50 percent of the time. Stick with one set of trading indicators for at least 50 to 100 trades before judging their performance.
Mistake #10: Using Technical Indicators Without a Demo Period
A trader sees a new Forex indicator, adds it to their live chart, and starts trading real money on the same day. That is a recipe for disaster. Every trading indicator has quirks. Some react faster. Some react slower. Some give false signals in certain market conditions. The only way to learn these quirks is to spend time on a demo account. Test new technical indicators for at least two weeks before putting real capital behind them. There is no shortcut.
How to Choose the Right Trading Indicators for Your Style
Not all trading indicators are created equal. More importantly, not every Forex indicator fits every trader. A scalper who holds trades for thirty seconds needs completely different technical indicators than a swing trader who holds positions for three weeks. Choosing the wrong tools for the wrong style is like wearing ski boots to a swimming pool. It just does not work.
Step One: Know Your Timeframe
The first question every trader must answer is this. How long will trades last? There are three main categories. Scalpers trade in minutes or even seconds. Day traders close everything before the market closes. Swing traders hold for days or weeks. Position traders hold for months or years. Each group needs different trading indicators.
Scalpers need fast, sensitive technical indicators that react instantly. Simple moving averages with very short periods work well. A 5 period or 9 period moving average is common. Slower Forex indicators like the 200 period moving average are useless for scalping. By the time the indicator sends a signal, the trade is already over.
Day traders have a bit more room. They can use trading indicators with moderate settings. 14 periods on RSI. 12 and 26 on MACD. These technical indicators give signals that last long enough to act on but are not so slow that the trader misses the move.
Swing traders and position traders need slow, reliable Forex indicators. A 200 period moving average is perfect for this group. The signals are rare. But when they come, they tend to last. These trading indicators filter out all the daily noise and show only the major moves.
Step Two: Know Your Market
Different markets behave differently. Forex, stocks, crypto, and commodities each have unique personalities. Forex indicators were often designed specifically for currency markets. That matters. EUR/USD behaves very differently than Tesla stock or Bitcoin. A technical indicator that works beautifully on gold might fail completely on the Japanese Yen.
The Forex market is open 24 hours a day, five days a week. That means trading indicators on Forex charts are always updating. There are no gaps in price. This is different from stocks, which close every day and sometimes gap up or down overnight. Many technical indicators rely on continuous price data. Gaps can mess up their calculations. That is why some Forex indicators work better on currencies than on equities.
Step Three: Know Your Personality
This one surprises most beginners. Trading indicators must match the trader’s personality. An impatient person cannot use slow, trend following technical indicators. They will take profits too early and exit trades before the real move happens. A cautious, risk averse person cannot use fast, aggressive Forex indicators. They will freeze up when the indicator gives a signal and miss the trade entirely.
Some trading indicators produce many signals. RSI and Stochastics are in this group. They are always saying something. Overbought. Oversold. Divergence. Cross back. Other technical indicators produce very few signals. The 200 period moving average crossover happens a few times per year on the daily chart. That is it. A trader who likes action will go crazy waiting for a signal from a slow Forex indicator. A trader who likes peace and quiet will feel overwhelmed by a fast one.
The right trading indicators feel comfortable. They fit like a pair of old jeans. There is no fighting. No forcing. The signals make sense. The trader trusts them. That trust is essential. Without it, every signal becomes a debate. And debating a signal means missing it.
Step Four: Start Simple and Add Slowly
The biggest mistake in this area is trying to learn too many trading indicators at once. A beginner sees a list of fifty technical indicators and wants to master them all. That is impossible. The better path is to pick one Forex indicator and learn it deeply. Trade with it on a demo account for one month. Learn what it does well. Learn what it does poorly. Learn when it fails. Only then add a second technical indicator to confirm signals.
Most professional traders use two or three trading indicators maximum. Some use just one. Almost no one uses more than four. There is a reason for that. Each additional Forex indicator adds complexity. Complexity adds confusion. Confusion leads to hesitation. Hesitation kills profits. Keep the setup clean. Keep it simple. That is how trading indicators actually help instead of hurt.
Step Five: Test Before You Trust
No amount of reading replaces real screen time. A trader can study technical indicators for months. They can memorize every formula and every setting. None of that matters until they sit in front of a live chart and watch the trading indicators move in real time. The market has a way of humbling book knowledge.
Take one Forex indicator. Put it on a demo chart. Watch it for one week. Do not trade. Just watch. See how it behaves when price trends. See how it behaves when price goes sideways. See how it reacts to big news events. See how it lags. See how it sometimes gives false signals. That week of watching is worth more than ten books.
After the watching week, start trading on demo. Take every signal the technical indicator gives for another week. Do not pick and choose. Take them all. That will reveal the true win rate. Some trading indicators work 60 percent of the time. Some work 40 percent. Both can be profitable if the risk management is right. But a trader will never know the real numbers without testing.
Step Six: Match the Indicator to the Job
A final word on matching. Trading indicators have specialties. Moving averages show trend direction. RSI shows overbought and oversold conditions. MACD shows momentum changes. Bollinger Bands show volatility expansion and contraction. ATR shows average range for stop placement. Volume indicators show participation and conviction.
Using a moving average to spot overbought conditions is silly. Using RSI to identify the trend is equally silly. Each technical indicator has a home. Learn what each Forex indicator does best. Use it for that job only. Trying to force a trading indicator to do something it was not designed for is a fast path to frustration.
The best traders treat trading indicators like a toolbox. A hammer drives nails. A screwdriver turns screws. A saw cuts wood. No tool is better or worse. They are just different. The same goes for technical indicators. There is no best Forex indicator. There is only the right tool for the right job at the right time.
Building a Simple Trading Routine with Indicators
Knowing how to use trading indicators is one thing. Using them consistently every single day is another. A good routine separates professionals from amateurs. The amateur wakes up, opens a chart, and stares at the screen hoping for a signal. The professional follows the same steps in the same order before every trading session. Here is a simple routine that works for most traders.
Step One: Check the Higher Timeframe First
Before looking at any technical indicators, zoom out. Pull up the daily chart and the weekly chart. What is the big picture? Is price making higher highs and higher lows? That is an uptrend. Lower highs and lower lows? That is a downtrend. Do not even think about entering a trade until this question is answered. Trading against the daily trend is possible but painful. Most beginners should simply avoid it.
Step Two: Mark Key Price Levels
Support and resistance levels work regardless of which Forex indicators are on the chart. Draw horizontal lines at recent highs and lows. Look for round numbers like 1.2000 on EUR/USD or 100.00 on USD/JPY. These levels matter because other traders watch them. When price approaches a key level, that is when trading indicators become most useful. They help answer the question. Is this level going to hold or break?
Step Three: Apply One or Two Technical Indicators
Now add the technical indicators to the chart. A simple setup might include a 50 period moving average to show the trend and an RSI in a separate window below. That is it. Two tools. Nothing more. Let the Forex indicators load and recalculate. Give them a few seconds to settle. A fresh chart with new data can show different signals than the chart from five minutes ago.
Step Four: Look for Confluence
Confluence is a fancy word for agreement. When the higher timeframe trend, the key price level, and the trading indicators all point in the same direction, that is confluence. For example, the daily trend is up. Price just bounced off a support level. The 50 period moving average is sloping upward. RSI is above 50 and moving higher. That is three reasons to consider a long trade. When these things line up, the probability of a winning trade goes up.
Step Five: Wait for the Trigger
Having a setup is not the same as taking a trade. Wait for a specific trigger. That could be a moving average crossover. A break above a recent high. An RSI moving back above 30 after being oversold. The trigger is the final green light. Without a trigger, do nothing. Many beginners see a good setup and jump in early. Then price goes against them for another hour before finally turning. Patience pays. Let the Forex indicators generate the actual signal before pulling the trigger.
Step Six: Set the Stop Loss Before Entering
This step happens before clicking the buy or sell button. Not after. Where is the stop loss going? A common method is to place it below the most recent swing low for a long trade or above the most recent swing high for a short trade. Another method uses the ATR indicator. Set the stop loss 1.5 or 2 times the average true range away from entry. The stop loss is the line in the sand. Once it is set, do not move it further away. Moving a stop loss is just admitting the trade was wrong but refusing to accept it.
Step Seven: Set a Realistic Target
Where does the trade end? Some traders use fixed risk to reward ratios. One to two is common. Risk one dollar to make two dollars. Others use the next key support or resistance level as a target. Moving averages can also act as targets. When price reaches a major moving average on the higher timeframe, that is a reasonable place to take profits. Whatever the method, have a target before entering. Hoping price will go up forever is not a plan.
Step Eight: Walk Away
Once the trade is on and the stop loss and target are set, walk away. Staring at the screen tick by tick does not help. It only creates anxiety. The trade will either hit the target or hit the stop. The technical indicators will not change that. Checking the chart every five minutes leads to emotional decisions. Checking once per hour is plenty for day traders. Swing traders can check once per day. Less screen time often leads to better results.
Step Nine: Review Every Trade
At the end of the day or week, look back at every trade taken. Which ones worked? Which ones failed? Was the Forex indicator signal correct or false? Did the trader follow the routine or break the rules? This review process is where real improvement happens. The market teaches lessons every single day. Traders who do not write down those lessons are doomed to repeat the same mistakes. Keep a trading journal. Write down the entry, exit, reason for the trade, and what could have been done better. Six months of journal entries is a goldmine of personal data.
Step Ten: Stay Consistent
The worst thing a trader can do is change the routine every week. This week the moving average is 50 periods. Next week it is 20. This week the stop loss is 20 pips. Next week it is 50. This inconsistency makes it impossible to know if the trading indicators are working or not. Pick a routine. Stick with it for at least 50 trades. Then, and only then, make small adjustments based on real data. Jumping from system to system is a guaranteed way to stay broke.
A final thought on routines. The best routine is the one that fits a trader’s life. A parent with a full time job cannot day trade on five minute charts. They need a swing trading routine with daily or weekly checks. A single person with flexible hours can handle a more active routine. There is no right or wrong. There is only what works for the individual trader. Build the routine around real life. Not the other way around.
The Truth About Lag and How to Work With It
Every beginner eventually asks the same question. Why do trading indicators always seem to be one step behind? The answer is simple. Because they are. Lag is not a bug. It is a feature. Understanding this changes everything about how a trader sees the charts.
What Causes Lag in Technical Indicators
Most technical indicators are based on moving averages. A moving average takes a set of past prices and draws a line. That line will always be behind the current price. It has to be. The calculation depends on old data. The more past data included, the smoother the line and the more lag. The less past data included, the choppier the line and the less lag. There is no way around this trade off. Smoothness costs speed. Speed costs smoothness.
Why Developers Do Not Fix Lag
New traders often wonder why smart programmers have not solved the lag problem. The reason is math. Any indicator that reacts instantly to every price change would be useless. It would bounce up and down like a jackrabbit. Every tiny wiggle in price would generate a new signal. The trader would buy and sell constantly and lose money on commissions and spreads. Lag is the price of filtering out noise. Without lag, Forex indicators would be unreadable.
The Rearview Mirror Analogy
Think of a car driving down a highway. The rearview mirror shows what is behind. No driver complains that the mirror is lagging. It is supposed to show the past. The windshield shows the future. A driver uses both. The mirror provides context. The windshield provides direction. Trading indicators are the rearview mirror. Price action is the windshield. Both are needed. One without the other is dangerous.
How Professional Traders Handle Lag
Successful traders do not fight lag. They embrace it. They understand that a lagging technical indicator is confirming a move that is already happening. That confirmation is valuable. It prevents the trader from guessing. It forces patience. A common saying among professionals is that the trend is your friend until the end. Lagging technical indicators help identify the trend. Once the trend is identified, the trader rides it. Getting in late is better than getting in wrong.
Combining Fast and Slow Indicators
One way to balance lag is to use two versions of the same technical indicator. A fast moving average with a short period. A slow moving average with a long period. The fast one reacts quickly but gives false signals. The slow one is reliable but late. When both point in the same direction, the signal is stronger. This is why moving average crossovers are so popular. The crossover itself is a signal that the fast indicator has caught up to the slow one.
Leading Indicators vs Lagging Indicators
Some Forex indicators claim to be leading indicators. They try to predict future price moves before they happen. Oscillators like RSI and Stochastics fall into this category. They warn when an asset is overbought or oversold. In theory, a trader can sell before the drop or buy before the rally. In practice, leading indicators are less reliable than lagging ones. They give many false signals. A trader who relies too heavily on leading trading indicators will get chopped up in strong trends.
The Best Approach for Beginners
New traders should focus on lagging technical indicators first. Moving averages. MACD. Bollinger Bands. These tools are straightforward. They tell a clear story. Over time, a trader can add a leading indicator like RSI for extra confirmation. But the core of the strategy should be lagging. It is easier to trust. It produces fewer signals. And fewer signals mean fewer chances to make a mistake.
Accepting Imperfection
No Forex indicator will ever give a signal at the exact bottom or top. Trying to catch the perfect entry is a fool’s errand. Professional traders are happy to catch the middle of a move. They do not need the first tick or the last tick. They need a solid chunk of the move in between. Lagging technical indicators provide exactly that. The signal comes after the move has started. There is still plenty of room left to run.
The Psychological Challenge
The hardest part of dealing with lag is psychological. A trader sees price moving up. They want to buy. But their technical indicator has not signaled yet. They wait. Price keeps moving. They feel like they are missing out. This feeling is called FOMO, fear of missing out. It is dangerous. Traders who give in to FOMO buy without a signal. Then price reverses and they get stuck. Waiting for the trading indicator to catch up is uncomfortable. But that discomfort is the price of discipline. Discipline keeps accounts alive. Impulse kills them.
When Lag Protects You
There is an upside to lag that most beginners overlook. Lag keeps traders out of trouble. When price reverses sharply, lagging technical indicators do not reverse immediately. They take time to turn around. That delay prevents the trader from panicking and selling at the worst possible moment. By the time the Forex indicator confirms the reversal, the worst of the damage is often over. The trader can exit with a smaller loss or even a small profit. Lag is not just a burden. It is also a shield.
Putting It All Together: A Sample Trading Plan
By now, the pieces are all on the table. Trading indicators are not magic. Forex indicators lag. They work better in some market conditions than others. The question is how to bring everything together into a single, actionable plan. Below is a sample trading plan that a beginner can follow. It is simple. It is specific. And it works in most market conditions.
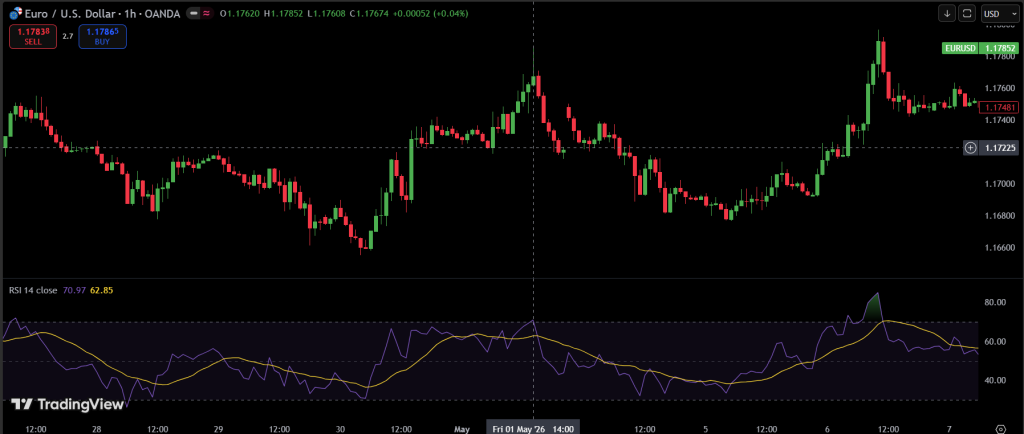
The Core Setup
This plan uses two trading indicators only. The first is a 50 period simple moving average on the daily chart. The second is the RSI set to 14 periods. That is it. No third indicator. No fourth. Just these two tools. A trader who masters this simple setup will be ahead of most beginners who use ten indicators and still lose money.
The Rules for Going Long
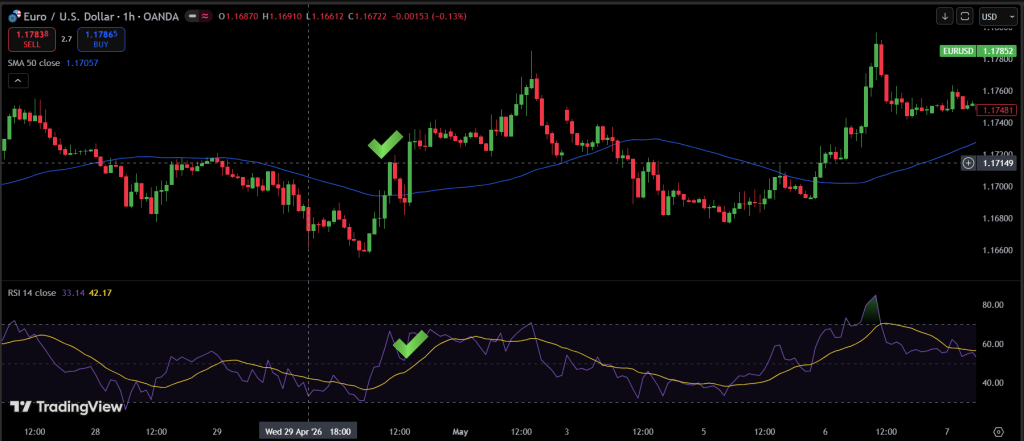
A long trade means buying with the expectation that price will go up. Here are the rules for a long signal. First, price must be above the 50 period moving average on the daily chart. That is the trend filter. No long trades if price is below the moving average. Second, RSI must be above 50 and rising. That confirms momentum to the upside. Third, wait for a pullback. Do not buy when price is racing higher. Wait for a dip down to the moving average or a key support level. Fourth, enter when price closes back above the previous candle’s high after the pullback. That is the trigger.
The Rules for Going Short
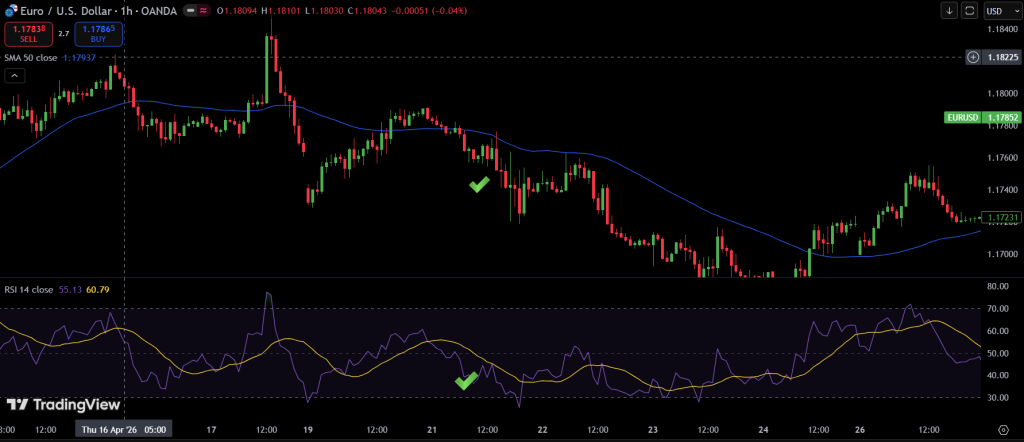
A short trade means selling with the expectation that price will go down. The rules are the opposite. First, price must be below the 50 period moving average on the daily chart. No short trades if price is above the moving average. Second, RSI must be below 50 and falling. That confirms momentum to the downside. Third, wait for a rally back up to the moving average or a key resistance level. Do not sell when price is falling fast. Fourth, enter when price closes back below the previous candle’s low after the rally fails.
Where to Place the Stop Loss
For long trades, place the stop loss below the most recent swing low. A swing low is a candle with a lower low than the candles on either side. Give the trade some room. If the swing low is 20 pips below entry, the stop loss could be 25 pips. The extra five pips prevent getting stopped out by random noise. For short trades, place the stop loss above the most recent swing high. Again, add a small buffer.
Where to Take Profit
The first target is the most recent swing high for long trades or swing low for short trades. That is the first level where price might reverse. Take partial profits there. Move the stop loss to breakeven on the remaining position. The second target is the next major support or resistance level on the daily chart. This could be 50, 100, or 200 pips away depending on the market. Let the trade run to that level if momentum remains strong.
When to Stay Out
A trading plan is not just about when to enter. It is also about when to do nothing. Stay out when price is crisscrossing the moving average back and forth. That is a sideways market. The technical indicators will give false signals. Stay out when RSI is stuck between 40 and 60. That means no momentum in either direction. Stay out before major news events like interest rate decisions or non-farm payroll reports. These events cause random spikes that stop out good trades. Stay out when feeling tired, angry, or distracted. Trading while emotional is a fast way to lose money.
The Daily Routine for This Plan
Every morning before the London or New York open, pull up the daily chart. Check where price is relative to the 50 period moving average. Check RSI. Mark the nearest swing high and swing low. That is five minutes of work. Then wait. Do not force a trade. The market will either present a setup or it will not. On days with no setup, do nothing. On days with a setup, execute the plan exactly as written. Do not change the rules halfway through.
The Weekly Review
Every Friday afternoon, review the week’s trades. How many signals appeared? How many were taken? How many won and how many lost? Was the stop loss placement correct? Could the target have been farther? Write everything down in a journal. Look for patterns. Perhaps the trading indicators work better on certain currency pairs. Perhaps they work better at certain times of day. The journal reveals these patterns over time. A trader who does not keep a journal is trading blind.
Expected Results
No trading plan wins every time. This one will lose 40 to 50 percent of its trades. That is normal. The key is that the winners need to be bigger than the losers. With a 1 to 2 risk to reward ratio, a 40 percent win rate is profitable. Do the math. Ten trades. Four winners at 2 dollars each is 8 dollars. Six losers at 1 dollar each is 6 dollars. Net profit is 2 dollars. Losing more than half the trades and still making money is the beauty of good risk management.
When to Change the Plan
Stick with the plan for at least 50 trades before making any changes. Fifty trades provide enough data to know if the technical indicators are working or not. Changing the rules after ten trades is pointless. That is not enough data. After 50 trades, look at the journal. If the win rate is below 35 percent, something is wrong. If the average loss is bigger than the average win, something is wrong. Make small adjustments. Move the moving average from 50 to 40 or 60. Adjust the RSI from 14 to 10 or 20. Test the new settings for another 50 trades. Rinse and repeat.
The Bottom Line
A simple plan followed consistently beats a perfect plan followed occasionally. Most beginners spend months searching for the holy grail of Forex indicators. That grail does not exist. What does exist is discipline. Show up every day. Follow the routine. Take the signals. Accept the losses. Let the winners run. Do that for six months and the results will speak for themselves. The market rewards consistency, not cleverness. Keep it simple. Keep it boring. That is how winning is done.
Conclusion
Stepping back, the big picture is simple. Trading indicators are nothing more than mathematical calculations drawn on a chart. They help traders see what the naked eye cannot. A moving average smooths out chaos. RSI measures emotional extremes. Bollinger Bands track volatility. Each tool serves a purpose. None of them is perfect.
The journey of learning technical indicators takes time. There will be false signals. There will be losing streaks. There will be moments of doubt. That is normal. Every trader goes through it. The ones who succeed are not the smartest or the luckiest. They are the ones who stick with a plan, manage risk, and refuse to quit after a few losses.
Remember the core truth. Forex indicators do not predict the future. They describe the present. They confirm what price is already doing. That confirmation is valuable. It keeps traders from guessing. It replaces gut feelings with data. It turns trading from gambling into a disciplined craft.
Start small. Pick one or two trading indicators. Learn them deeply. Trade on a demo account until consistency is achieved. Then, and only then, move to real money with tiny position sizes. Keep a journal. Review every trade. Make small improvements over time. There are no shortcuts. But the path is clear for anyone willing to walk it.
The market will always be there. There is no rush. Take the time to do it right. Good luck.
FAQ
What are trading indicators?
Trading indicators are mathematical calculations plotted on a price chart as lines, histograms, or dots. They take raw data like open, close, high, and low prices and turn it into visual signals. Think of them as a calculator for market conditions. They help traders see trends, momentum, volatility, and potential reversal points without staring at raw price numbers all day.
What is a trading indicator in simple terms?
In simple terms, a trading indicator is a tool that answers a specific question about the market. Is the trend up or down? Is the asset overbought or oversold? Is volatility increasing or decreasing? The indicator crunches the numbers and shows the answer on the chart. No advanced math degree is required to use one.
What is indicators in trading?
Indicators in trading are the building blocks of technical analysis. They come in two main flavors. Leading indicators try to predict future price moves. Lagging indicators confirm moves that are already happening. Most traders use a mix of both. Common examples include moving averages, RSI, MACD, and Bollinger Bands.
What does indicators mean in trading?
In trading, indicators mean context. A price of 1.2000 on EUR/USD means nothing by itself. But add a moving average showing price is above the long term trend, and now there is context. Add RSI showing strong momentum, and the picture gets clearer. Indicators take isolated numbers and turn them into a story.
What are trading indicators used for?
Trading indicators are used for four main jobs. First, identifying the trend direction. Second, spotting entry and exit points. Third, measuring momentum strength. Fourth, setting stop loss levels based on volatility. Some traders also use them to filter out false signals or to confirm what their own price analysis is showing.
What do trading indicators do?
Trading indicators do three specific things. They clarify messy price action into clean visuals. They confirm or challenge a trader’s gut feeling with hard data. And they warn when something looks wrong, like a divergence between price and momentum. A good indicator does not make decisions. It provides information so the trader can make better decisions.
What is the use of indicators in trading?
The use of indicators in trading is to stack the odds in the trader’s favor. No indicator is right 100 percent of the time. But a trader who uses one or two reliable indicators will make better decisions than a trader who guesses based on emotion. Indicators do not guarantee profits. They simply increase the probability of making a good trade.
What is technical indicators definition?
A technical indicator is any chart tool that uses mathematical formulas based on price, volume, or open interest to help analyze market conditions. Technical indicators are the core of technical analysis. They transform raw market data into actionable signals. Moving averages, RSI, and MACD are all examples of technical indicators.
What is a Forex indicator?
A Forex indicator is simply a technical indicator used specifically on currency pairs. The Forex market has unique characteristics. It is open 24 hours a day. It has no daily closing gaps. It is heavily influenced by interest rates and economic news. Some indicators work better on Forex than on stocks or crypto. But the math behind them is exactly the same.
What are technical analysis tools?
Technical analysis tools include everything a trader uses to study price charts. Indicators are one category of tools. Chart patterns like head and shoulders are another. Trendlines and support resistance levels are tools too. Volume analysis is another tool. Indicators are just one piece of a much larger toolbox that traders rely on.
What are chart tools to examine price, time, and participation?
Chart tools in this category include anything that looks at three dimensions. Price tools show levels and trends. Time tools show cycles and seasonality. Participation tools show volume and momentum. Bollinger Bands examine price and volatility. On Balance Volume examines participation. Moving averages examine price and time together. The best trading setups combine all three dimensions into one analysis.

