Hanging Man
Pattern Setup
Picture this. You are watching a stock rip higher for days. Everyone is feeling good. Then suddenly, out of nowhere, a candle shows up with a tiny body and a long wick dangling down like a guy hanging off a cliff. Looks scary, right? That is not just random. That is the Hanging Man.
So what is a hanging man pattern in plain English? It is a one-candle warning sign that appears after a big price run. The candle has three simple features. A tiny real body (red or green). A long lower shadow at least twice the size of the body. And little to no upper shadow. Basically, the open and close happen near the top.
But here is where beginners mess up. The hanging man pattern meaning is not just about the shape. It is all about where the candle shows up. Catch one at the top of an uptrend? That is your clue that bulls might be losing their grip. See the exact same candle at the bottom of a downtrend? That is called a Hammer. And that is actually a good thing.
Yeah, trading can be that tricky. But do not sweat it.
In this guide, I will walk you through exactly how to spot the hanging man, what it is telling you, and most importantly, how to trade it without getting faked out. No fluff. Just real talk.
Let us dive in.
What Is a Hanging Man Pattern?
Let us start with the basics. No fluff. Just what you need to know.
A hanging man pattern in trading is a single candlestick that shows up after an uptrend. It looks like a little guy hanging from a rope. The body is small and sitting near the top of the candle. The lower shadow is long. The upper shadow is tiny or completely missing.
Think of it this way. During the trading session, buyers pushed the price up. But then sellers showed up and dragged the price way down. By the close, buyers managed to pull it back up a little, but they could not get back to the high. That struggle leaves a mark. A long lower shadow and a small body near the top.
So what is a hanging man pattern really telling you? It is a warning. The bulls are getting tired. The bears are starting to wake up.
Now, here is something important. You will also hear people talk about the hanging man pattern in stock market contexts. It works the same way whether you are trading Apple, Tesla, or a small cap stock. The psychology does not change. Buyers try to hold the line. Sellers push back hard. The hanging man captures that fight in one candle.
But do not jump to conclusions just because you see the shape. You still need two things. A clear uptrend before the candle. And confirmation after it. Without those, you are just looking at a weird candle, not a real signal.
In the next section, we will break down the psychology behind why this little candle carries so much weight. Because once you understand what traders are thinking, spotting reversals becomes second nature.
Hanging Man Candlestick Meaning & Psychology
Alright, let us get inside the head of the market. Because once you understand what traders are feeling, the charts start to make a lot more sense.
So what is the hanging man candlestick meaning on a deeper level? It is fear disguised as hope.
Let me walk you through the trading session step by step.
The market opens. Bulls are feeling confident because the uptrend has been strong. They push prices higher. Everything looks good. Then halfway through the session, something changes. Sellers step in and start hammering the price down. Not a little dip. A real drop. The price falls way below where it opened.
Now here is the kicker. By the end of the session, buyers manage to push the price back up near the open. The candle closes with a tiny body at the top. To an untrained eye, it looks like bulls saved the day. But that long lower shadow tells a different story.
The hanging man pattern meaning is simple. Bulls are losing control. They could not hold their highs. They got pushed down hard and barely scraped back. It is like a boxer who takes a huge punch, stands up, but his legs are wobbly. Sure, he is still standing. But he is not winning.
That is exactly why the hanging man candlestick meaning is bearish. It does not guarantee a crash. But it says the party might be over. Sellers are showing up. And if they show up again the next day, the trend could reverse.
There is one more piece to the psychology. A red hanging man (close lower than open) is more bearish than a green one. Why? Because it means sellers actually won the session. Bulls tried to close higher but failed. A green hanging man still has some hope left. But make no mistake. Both are warnings.
So the next time you see one, do not just stare at the shape. Ask yourself. Who is really in control right now? The long lower shadow is screaming that sellers came to play.
In the next section, we will get into the rules. Because you cannot just trade every hanging man you see. You need a system.
Hanging Man Pattern Rules & Identification
Hanging Man Rules
& Identification
Okay, time to get serious. You know what the hanging man looks like. You know what it means psychologically. But if you start trading every candle that has a long lower shadow, you are going to get wrecked. Trust me.
You need rules. Clear, strict, no-excuses rules.
Let me give you the exact hanging man pattern rules that professional traders look for.
Rule 1: There must be a prior uptrend.
This is non-negotiable. The hanging man is a hanging man reversal pattern. That means it reverses an uptrend. No uptrend? No hanging man. It is just a random candle. So pull back on your chart and look left. Prices should be moving up for at least several candles before you even think about calling it a hanging man.
Rule 2: The lower shadow must be at least twice the length of the real body.
Get out your ruler. Or just eyeball it. The body is small. The wick is long. If they are about the same size, that is not a hanging man. That is something else.
Rule 3: Little to no upper shadow.
The open and close should be near the top of the candle. If there is a long wick sticking out the top, the pattern gets weaker. Not invalid necessarily, but weaker.
Rule 4: The real body can be red or green.
But here is the truth. A red body is more bearish. It means sellers actually closed the session lower. A green body still works, but you want extra confirmation.
Rule 5: Wait for confirmation.
This is where beginners blow it. The hanging man itself is not the sell signal. It is the warning. The confirmation is the next candle closing below the hanging man’s low. Some traders even wait for two candles. Do not skip this step. I promise you, fakes happen all the time.
So what is the hanging man technical pattern actually telling you? It is a heads up. Something might be changing. But you do not act until you see proof.
And here is a pro tip. The hanging man reversal pattern works better on daily and weekly charts. On smaller timeframes like 5 minutes or 15 minutes, you get too much noise. You will see hanging men everywhere. Most of them are meaningless. Stick to higher timeframes for cleaner signals.
Let me give you a quick checklist you can use right now.
- Is there an uptrend before the candle? Yes or no.
- Is the lower shadow at least twice the body? Yes or no.
- Is there almost no upper shadow? Yes or no.
- Do you have confirmation on the next candle? Yes or no.
If you answer yes to all four, you have a legit the hanging man pattern. If you miss even one, walk away. There will always be another trade.
In the next section, we will look at real examples and charts so you can see exactly what this thing looks like in the wild.
Hanging Man Candlestick Examples & Chart
Let us be real. Reading about candlesticks is great. But seeing them on an actual chart? That is where the light bulb turns on.
You do not need me to give you specific stock names. You will find plenty of hanging man candlestick examples on your own screen. Just pull up any daily chart after a nice run higher. Scroll through. I promise you will spot one.
So what exactly are you looking for?
Here is a simple checklist you can use right now on any chart.
Step one. Look for an uptrend. Nothing crazy. Just a series of higher highs and higher lows.
Step two. Find a candle with a tiny body near the top. The color does not matter yet.
Step three. Check the lower shadow. It should be long. At least twice the size of that tiny body.
Step four. Check the upper shadow. There should be almost nothing there. The open and close are hugging the top.
Step five. Look at the next candle. Is it closing below the low of that suspicious candle? That is your confirmation.
That whole setup is a clean hanging man pattern example.
Now let me show you how to spot the hanging man pattern in chart without overthinking it. Zoom out first. Make sure you are actually at a peak. A lot of beginners see the shape and pull the trigger, but they missed the fact that the trend was already sideways or even down. The hanging man only works at the top of an uptrend. End of story.
Here is how the candle looks like.
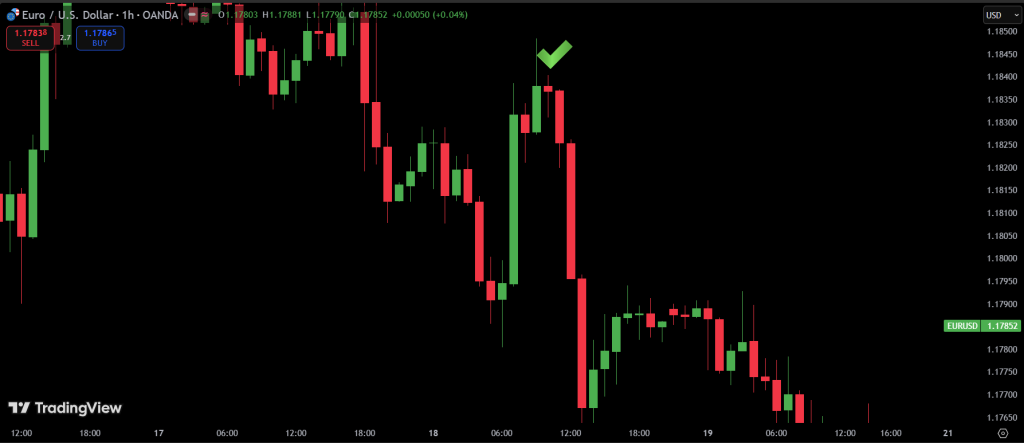
If you want to see hanging man pattern images or a hanging man candlestick photo, just open your trading platform. Thinkorswim. TradingView. Webull. Does not matter. Find any asset that rallied. Then look for that small body with the long wick hanging down. It sticks out like a sore thumb once you know what to look for.
And here is a pro tip. Do not just stare at the shape. Look at the location. Is the candle sitting near recent highs? Has the market been going up for a while? If yes, you might have something real. If not, keep scrolling.
You will add your own screenshots and real examples later. That is the best way to learn anyway. Mark up your charts. Draw arrows. Circle the hanging man and the confirmation candle. Make it yours.
In the next section, I will show you exactly how to trade this thing. Entry. Stop loss. Target. The whole game plan. No guesswork.
How to Trade the Hanging Man Pattern
Alright, let us get to the good stuff. You spotted the pattern. You followed the rules. Now what? How do you actually make money from this thing?
Do not worry. I will give you a simple step-by-step plan. No overcomplicating it. Just entry, stop loss, and target.
Step 1: Wait for confirmation.
I said it before, and I will say it again. The hanging man itself is not your trigger. It is the warning. The trading hanging man pattern starts with patience. You wait for the next candle to close below the low of the hanging man. That is your green light. Do not jump in early. The market loves to fake out impatient traders.
Step 2: Enter the trade.
Once the confirmation candle closes below the hanging man’s low, you enter short. Some traders enter right at the open of the next candle. Others wait for a little retest of the broken level. Either way works. Just pick one and stick to it. The key is that you are now officially hanging man pattern trading.
Step 3: Set your stop loss.
This is non-negotiable. Put your stop loss just above the high of the hanging man. Why? Because if the price breaks above that high, the pattern failed. The bulls won. You do not want to be in that trade anymore. Give the market room to breathe, but protect your capital.
Step 4: Set your target.
Here is where a lot of beginners freeze up. How far should the price drop? A good rule of thumb is to look for the most recent support level. That could be a previous low, a moving average, or a trendline. Another approach is a simple risk-reward ratio. Aim for at least 1 to 2. If your risk is one dollar per share, target two dollars. That way you only need to be right half the time to make money.
Step 5: Manage the trade.
Once the trade moves in your favor, consider moving your stop loss to breakeven. That takes the pressure off. Then let the trade breathe. Do not micromanage every wiggle. The best how to trade hanging man candlestick pattern advice I ever got was this. Get in. Set your levels. Walk away. Check back at the close.
Let me give you a real quick example without using specific stocks.
Imagine a stock rallies from $50 to $60. A Hanging Man forms near the resistance area at $60, with a low at $58. The next day, the stock closes at $57.50, below the Hanging Man low. That provides bearish confirmation for the setup.
A trader enters a short position near $57.50. The stop-loss is placed at $60.50, just above the Hanging Man high, while the target is set at $54.00, a previous support level.
In this example, the trade risks $3.00 per share for a potential reward of $3.50 per share, giving a risk-to-reward ratio slightly better than 1:1.
That is the whole game plan. Simple. Clean. Repeatable.
Now here is something most people will not tell you. The hanging man candlestick trading works best when you combine it with something else. Volume is a big one. Higher volume on the hanging man day means more institutions are selling. Divergence on the RSI or MACD adds even more weight. But do not get paralyzed by indicators. Start with price action first. Add tools later.
One more thing. Do not force it. Some weeks you will see five hanging men. Some weeks you will see zero. That is fine. The market does not owe you trades. Wait for high-quality setups with clear confirmations. Your future self will thank you.
In the next section, we will talk about the difference between a hanging man and a hammer. Because trust me, beginners mix these up all the time. And that mistake costs real money.
Hanging Man Pattern vs. Hammer – Key Differences
This is where so many traders get tripped up. And honestly, I do not blame you. The hanging man and the hammer look exactly the same. Same shape. Same long lower shadow. Same tiny body near the top. Same little to no upper shadow.
So what gives?
The difference is not in the candle itself. It is in where the candle shows up on your chart.
Let me break it down for you.
The Hanging Man
You see this candle after an uptrend. Price has been moving up for a while. Then bam. A small body with a long wick hanging down. That is your hanging man. It is bearish. It means sellers are waking up and the party might be over.
The Hammer
You see this candle after a downtrend. Price has been falling. Sellers are in control. Then a candle with a tiny body and a long lower shadow appears. That is a hammer. It is bullish. It means buyers stepped in, rejected the lows, and pushed price back up. A reversal could be coming.
Same shape. Opposite meaning. All because of the trend.
Here is a simple way to remember it. If the market is going up and you see that shape, picture a guy hanging from a rope. Not good. If the market is going down and you see that shape, picture a hammer smashing the floor. Someone is building something new.
So when someone asks you what does a hanging man candlestick pattern typically indicate, your answer is simple. A potential bearish reversal after an uptrend. Not a hammer. Not a bottom signal. A top signal.
And if someone asks about the hanging man parallel, that is not really a standard term. Some traders use it to talk about two hanging men showing up side by side. That is even more bearish. But the classic comparison is always hanging man versus hammer. Trend is everything.
Let me give you a quick cheat sheet.
Hanging Man
- Appears in an uptrend
- Bearish reversal signal
- Look to sell or short
Hammer
- Appears in a downtrend
- Bullish reversal signal
- Look to buy or cover shorts
Do not overthink it. Just check what came before the candle. That is the secret. Beginners stare at the shape. Pros stare at the trend.
In the next section, we will cover common mistakes and limitations. Because even a perfect hanging man can fail if you ignore the context.
Common Mistakes & Limitations
Let me save you some heartache. You can do everything right and still lose money on a hanging man. Why? Because no pattern works 100 percent of the time. The market loves to humble people.
So let us talk about the mistakes beginners make and the real limitations of this pattern.
Mistake 1: Trading without confirmation
This is the biggest one. You see a hanging man and immediately hit sell. That is gambling, not trading. I have seen hundreds of hanging men that went nowhere. The confirmation candle is your filter. Without it, you are guessing. Wait for the next candle to close below the low. End of story.
Mistake 2: Ignoring the trend
The hanging man only works after an uptrend. Not a sideways market. Not a downtrend. An uptrend. If you try to trade this pattern in a flat market, you will get chopped to pieces. Check left on your chart before you do anything else.
Mistake 3: Using it on tiny timeframes
A hanging man on a 1-minute or 5-minute chart is noise. Random. Meaningless. The pattern was designed for daily and weekly charts. Stick to higher timeframes. The signals are cleaner and way more reliable.
Mistake 4: Risking too much on one trade
Even a perfect setup fails sometimes. Maybe earnings are coming up. Maybe news drops. Maybe the market just feels like doing the opposite of what you expect. That is why you never go all in. Keep your risk small. One bad trade should not blow up your account.
Mistake 5: Forcing trades when there are none
Some weeks you will not see a single good hanging man. And that is fine. Beginners feel like they have to trade every day. You do not. Sit on your hands. Wait for high-probability setups. The market will still be there tomorrow.
Limitations of the pattern
Here is the truth. The why is a hanging man bearish question has a solid answer. Sellers rejected the highs. But that does not mean the price crashes. Sometimes the hanging man leads to a small pullback, not a full reversal. Other times it fails completely and price makes a new high the next week.
The hanging man pattern indicates potential weakness. Not a guarantee. You are trading probabilities, not certainties. That is why you use a stop loss. That is why you wait for confirmation. That is why you manage risk.
Also, low liquidity stocks are tricky. The hanging man can show up because of one big seller, not a real shift in sentiment. Stick to liquid names. The pattern works much better there.
One more thing. Do not rely on the hanging man alone. Combine it with support and resistance, volume, or momentum indicators like RSI. The more evidence you have, the better your odds.
In the next section, we will look at how the hanging man works in different markets like stocks, forex, and crypto.
Hanging Man Pattern in Different Markets
Here is some good news. You are not stuck trading this pattern on just stocks. The hanging man works across all kinds of markets. Stocks. Forex. Crypto. Commodities. Even ETFs.
The psychology is the same everywhere. Buyers get tired. Sellers show up. The candle prints that long lower shadow.
Let me walk you through how it plays out in different markets.
Stocks
This is where the hanging man is most popular. Blue chips. Small caps. Tech. Energy. Does not matter. After a nice run up, a hanging man with confirmation can signal a nice pullback. Just stay away from illiquid penny stocks. The pattern gets weird there.
Forex
Currency pairs like EUR/USD or GBP/USD also print hanging men. But here is the catch. Forex moves 24 hours a day. A hanging man on a daily chart is still valid, but you might get more false signals because of news spikes. Use the same rules. Uptrend. Long lower shadow. Confirmation. And consider adding a volume indicator if your platform has it.
Crypto
Bitcoin. Ethereum. Solana. The crypto market loves hanging men. Why? Because crypto moves fast and emotions run high. A hanging man at the top of a big green candle can work beautifully. Just be careful. Crypto is volatile. Your stop loss might need a little extra room.
Commodities
Gold, silver, oil. These markets tend to trend nicely. A hanging man pattern chartink scan can help you spot them quickly if you use that platform. Same rules apply. Wait for the uptrend. Wait for confirmation. Do not jump early.
Using Scanners
Speaking of scanning, you can use tools like hanging man pattern chartink or hanging man candlestick chartink to find these setups automatically. Just set the filter to look for a small body, a long lower shadow, and an uptrend. The scanner does the heavy lifting. You just check the charts for confirmation.
But do not rely on scanners alone. Always look at the chart with your own eyes. A scanner might show you a hanging man that formed in the middle of a sideways mess. That is useless. You still need to check the trend and context.
Which market is best?
Honestly, stocks and crypto give the cleanest signals. Forex is fine, but the 24-hour nature adds noise. Commodities work well when they are trending. Start with stocks on daily charts. Master that. Then branch out.
In the next section, we will cover some quick visual resources and where to find good images and PDFs for your own reference.
Conclusion
Alright, let us bring it all together.
You came here asking what is a hanging man chart pattern. And now you know. It is a single candle with a tiny body, a long lower shadow, and almost no upper shadow. It shows up after an uptrend. And it warns you that buyers might be losing steam.
You also learned the what is hanging man chart pattern meaning on a deeper level. It is not just a shape. It is a story. Buyers pushed price up. Sellers slammed it down. Buyers barely pulled it back. That struggle leaves a mark. And that mark can be money in your pocket if you trade it correctly.
Let me quickly recap the most important points.
First, context is everything. The same candle in a downtrend is a hammer. Do not mix them up.
Second, always wait for confirmation. The hanging man itself is not the trade. The confirmation candle is.
Third, use a stop loss. Place it just above the hanging man’s high. No exceptions.
Fourth, combine the pattern with other tools. Volume. Support and resistance. RSI. The more evidence, the better.
Fifth, practice on higher timeframes first. Daily charts are your friend. Leave the 5-minute chaos for later.
The hanging man pattern in trading is not a magic bullet. It will not make you rich overnight. No pattern will. But it is a valuable tool in your toolbox. When you spot it in the right place with the right confirmation, it gives you an edge. And in trading, an edge is all you need.
One last thing. Do not overtrade. Do not force setups. The best traders are patient. They wait for their pattern. They execute. They manage risk. Then they do it again.
Now go open your charts. Scroll through some daily charts. Find a few hanging men. Mark them. See how price behaved after. That is how you get better. Not by reading one guide. By doing the work.
Good luck. And do not forget to confirm.
FAQ
1. What does a hanging man candlestick pattern typically indicate?
It typically indicates a potential bearish reversal after an uptrend. The long lower shadow shows that sellers rejected the highs and pushed price down. Buyers managed to close near the top, but they look tired. It is a warning, not a guarantee.
2. Why is a hanging man bearish?
It is bearish because the price got rejected hard during the session. Sellers stepped in and drove the price way down. Even though buyers pulled it back up by the close, the fact that price fell so far shows weakness. The bulls are losing control.
3. What is the difference between a hanging man and a hammer?
Same shape. Different trend. A hanging man appears after an uptrend and is bearish. A hammer appears after a downtrend and is bullish. Always check what came before the candle.
4. Can the hanging man be green?
Yes, a green hanging man still works. But a red hanging man is more bearish because the sellers actually won the session. A green hanging man means buyers still had some fight left. Either way, both need confirmation.
5. Do I need confirmation before trading?
Yes, yes, and yes. Never trade the hanging man by itself. Wait for the next candle to close below the low of the hanging man. That is your trigger. Without confirmation, you are gambling.
6. What does “hanging man parallel” mean?
That is not a standard trading term. Some traders use it to describe two hanging men forming side by side. That would be even more bearish. But the classic comparison is always hanging man versus hammer.
7. Does the hanging man work in crypto?
Yes. Bitcoin, Ethereum, and other cryptos print hanging men all the time. Just be careful with volatility. You may need to give your stop loss a little extra room. Same rules apply. Uptrend. Long lower shadow. Confirmation.
8. Can I use the hanging man on a 5-minute chart?
You can, but you probably should not. The pattern was designed for daily and weekly charts. On small timeframes, you get too much noise and too many fake signals. Stick to higher timeframes for cleaner trades.
9. What is the success rate of the hanging man pattern?
There is no exact number. It depends on the market, the timeframe, and how strictly you follow the rules. With confirmation, volume, and a clear uptrend, your odds are decent. Without those, your odds are poor. No pattern works 100 percent of the time.
10. Is the hanging man pattern the same as a shooting star?
No. They can look similar, but a shooting star has a long upper shadow, not a long lower shadow. A shooting star forms after an uptrend as well, but the psychology is different. That is a topic for another guide.

